Well, I guess stats why they call it the blues.
And you can beat those January blues with our first stats round-up of the new year. Filled to the brim with the very best data analysis on digital marketing and e-commerce this week.
Then maybe afterward we can find out exactly where the brim of the internet really is.
Amazon’s Christmas
Amazon shipped 5bn items in 2014, with 40% from third-party sellers. According to the company, third-party sellers sold more than 2bn items in 2014.
Those 2bn items came from more than 2m sellers, which accounts for over 40% of the total units sold on Amazon.
Christmas mobile stats
Affiliate Window has revealed the following stats for mobile retail in December.
- Boxing Day saw an excess of 50% of traffic through a mobile device for the first time ever.
- 47,100 sales each day originated from a mobile device (smartphone and tablet).
- 19,900 of these were through a smartphone.
- 664 clicks originated from a mobile device every minute.
- 822 sales were generated through a smartphone each hour.
- 32.75% of revenue generated for its advertisers in December was through a mobile device.
A fifth of holiday shoppers wait until the last minute
Nearly 20% of all holiday shoppers wait until the last minute to buy their gifts according to Retale.
58% of all last-minute shoppers use smartphones and tablets to help them shop and among this group, 88% use their mobile devices to locate stores and check store hours as they get closer to Christmas Day.
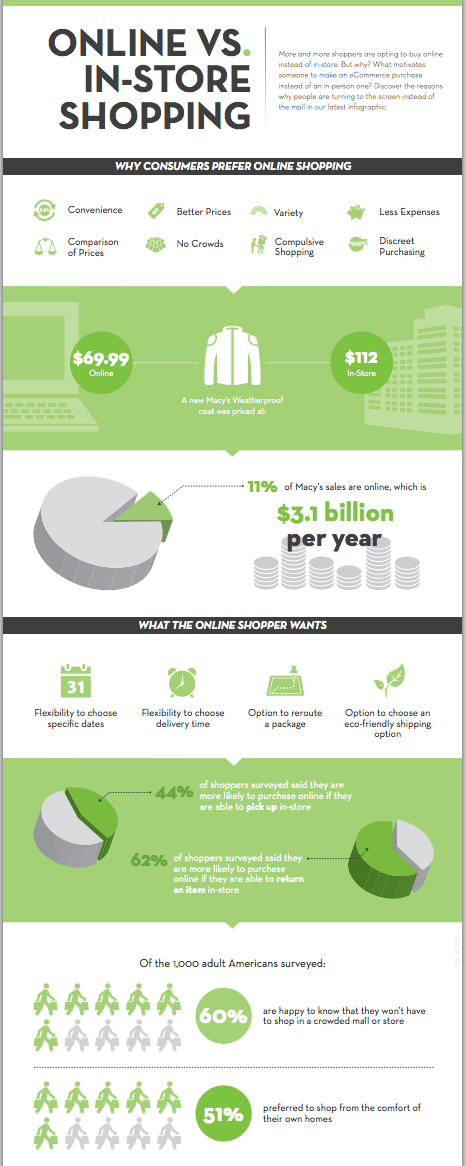
Online vs. in-store shopping
Nextopia has shared the following infographic on why consumers prefer online shopping, including such stats as 44% of shoppers surveyed said they are more likely to purchase online if they are able to pick up in-store, and that 62% are more likely to shop online if they can return an item in-store.
Christmas shopping woes
According to JDA/YouGov research, nearly one in three British online Christmas shoppers experienced problems with orders. Here are some more stats from the survey:
- 49% had suffered from missed deliveries, while 45% had experienced late deliveries or never received their goods.
- 47% of Brits did at least half of their shopping online; of those who did Christmas shopping, 18% stated that they did more Christmas shopping online than they originally planned.
- 29% ended up ordering items earlier than planned as a result of retailers setting ordering deadlines a week or more in advance of Christmas Day.
- 17% of shoppers stated that ordering deadlines had made them shop at a store instead of online.
Christmas click and collect
From the same YouGov research, here are some stats for click and collect usage in December:
- 39% of online shoppers opted to use click and collect services this Christmas.
- One-quarter of shoppers stated they chose to shop specifically with a retailer that offered click and collect over one that solely offered home delivery.
- 19% of online shoppers used an alternative retailer this Christmas as result of their preferred one not having items available online or having delivery times that met their requirements.
Although 40% of clicks and collect shoppers had a very positive experience of using the service, 35% of users encountered negative issues:
- 30% experienced long waiting times due to a lack of in-store staff.
- 29% cited a lack of a dedicated area in-store for click and collect purchases.
- 25% said, staff were unable to look or took a long time to source goods in-store.
There’s more on click and collect here: What have we learned about click and collect this Christmas?
One-quarter of shoppers will return goods
Retale has polled holiday shoppers and discovered that nearly one in four will return or exchange at least one of the presents they received this holiday season. Here are some additional stats:
- 70% prefer to return or exchange gifts in-store versus online.
- 62% said the in-store return and exchange process was convenient.
- Nearly 40% called the online return and exchange process inconvenient.
- 85% want retailers to allow in-store returns or exchanges of gifts bought online.
Non-marketing stat of the week
There were more than 22,000 manmade objects orbiting the Earth in 2013.

Then in October that year, the upper stage of a Russian rocket disintegrated in low Earth orbit and now there are 500 more.
Retailers could do more for mobile shoppers
Somo has analyzed the mobile capabilities of the top 50 high street retailers, finding that:
- 40% do not have a mobile optimized store locator.
- 20% don’t have a transactional mobile site.
- 30% don’t have an iOS app.
- 28% don’t have an Android app.
- 44% do not have a tablet optimized site.
- 46% don’t support responsive web design.
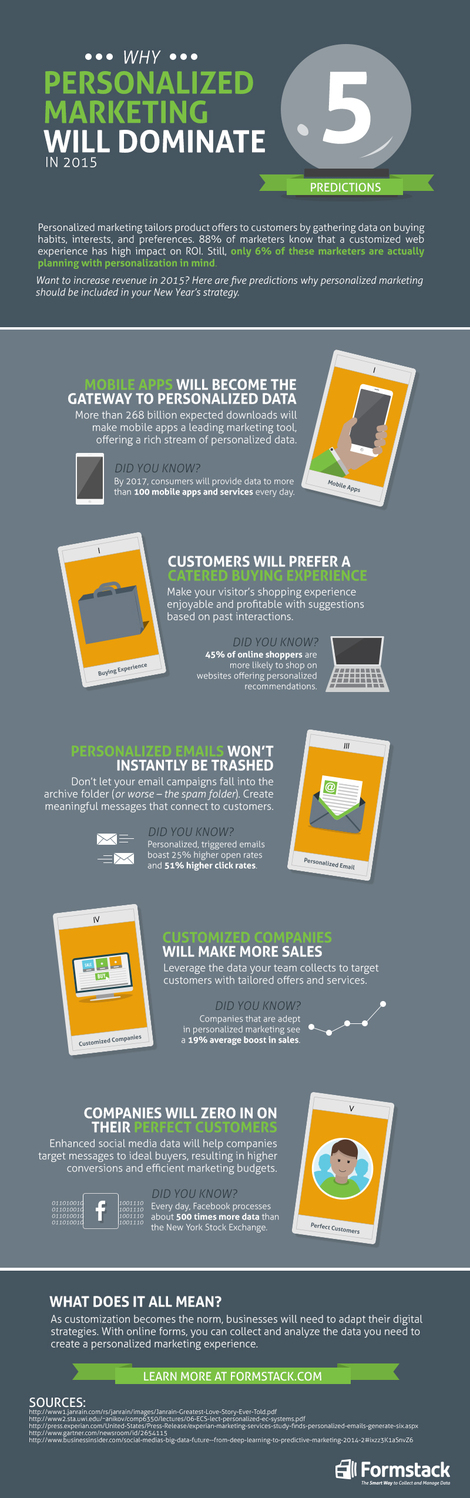
Personalized marketing set to dominate 2015
Here’s an infographic from Formstack, claiming that 45% of online shoppers are more likely to shop on websites offering personalized recommendations, while personalized triggered emails boast 25% higher open rates and 51% higher click-through rates.
YouTube’s most watched ads of 2014
According to Google itself, the top 10 ads earned a combined 330m views globally and contrary to expectation, Sainsbury’s Christmas ad topped the charts, racking up more UK views than the John Lewis Christmas advert.
Here’s the chart.
- Sainsbury’s Christmas 2014 Ad
- John Lewis Christmas Advert 2014 #MontyThePenguin
- Nike Football: Winner Stays
- Nike Football: The Last Game
- Always #LikeAGirl
- Three #SingItKitty
- Marks & Spencer #FollowTheFairies
- Save the Children – Most Shocking Second a Day
- Guinness – Sapeurs
- Pepsi Max – Human Loop the Loop
Four big reveals from CMOs
Conductor has asked 182 marketing executives about where they think the digital media industry is heading in 2015:
- 61% of marketing executives say data is “more” or “much more” important than it was 12 months ago.
- 65% of marketing executives plan on spending more on marketing technology in the coming year, with a large percentage (28%) planning to spend significantly more (25% or more).
- On a 4-level scale from “not important” to “very important,” customer research was “very important” to content creation across all organization types (B2B, B2C, Agency).
- Agencies were most in agreement about the need for pre-content research; 85% of agency executives deemed it “very important” while 76% of B2B executives also described it as “very important.”
- 90% of those surveyed agree that inter-department support is “important” or “very important” to their brands’ digital marketing success.
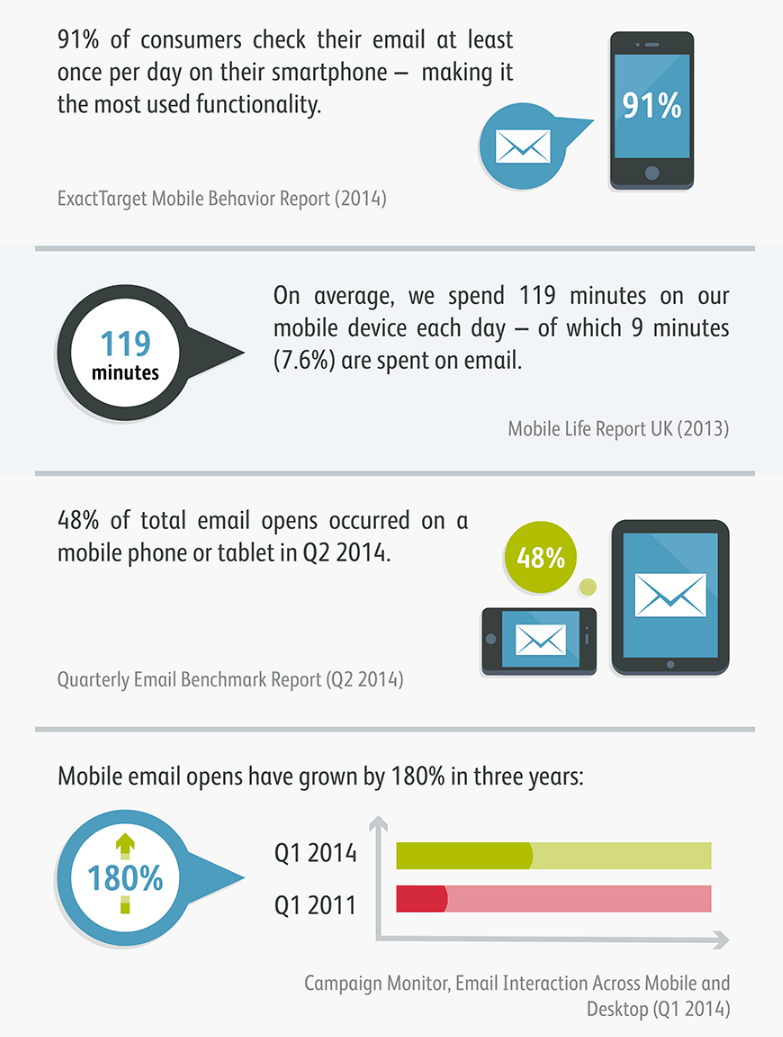
Responsive email design is no longer optional
Instiller and Wyzowl have created this infographic full of stats to show how responsive email design *is* email design.
Get away
A recent report by Hotels.com stated that traffic to UK booking websites peaked at 8 pm on 28 December.
According to the Telegraph, Thomson and First Choice reported record traffic over Christmas and Boxing Day, with nearly 940,000 people researching holidays on the internet. A 30% rise on last year.
The most popular time for holiday searches on Boxing Day was apparently between 9 pm and 10 pm during the Birds of a Feather Christmas special.
Make of that what you will. As a side note, here are 10 essential features all travel websites must have to capitalise on this.
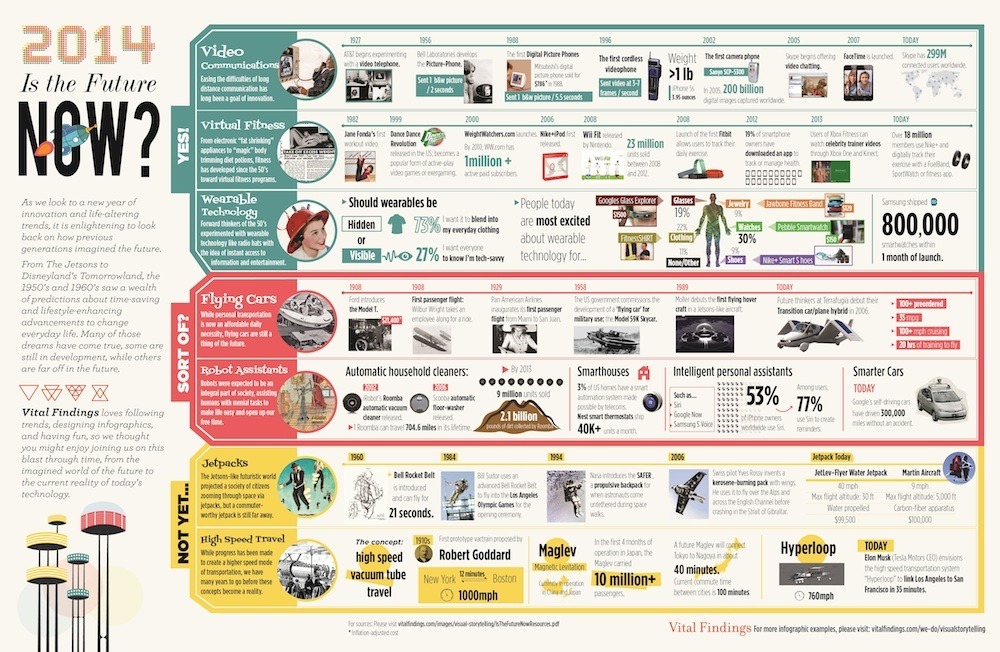
Non-marketing infographic of the week
Let’s check to see how many fanciful sci-fi predictions from the 50s and 60s have now come true as we enter the year 2015, a time when Marty McFy would eventually misplace his sports almanac.
Adopted from Econsultancy
Managing Director Analytics & Digital at Ayruz Datamarketing, He is the Co-Founder of Ayruz and MobME Wireless. He holds an MBA, Strategy and Entrepreneurship (University of Strathclyde) and B-Tech in Computer Science from Cochin University.