

Vishak N Kumar


Vishak N Kumar
Blogs

How to Dynamically Load Google Tag Manager and Improve Page Speed in 2025
Modern websites often struggle with speed issues caused by bloated or unoptimized tag management. In 2025, digital leaders like Stripe are turning to smart alternatives, such as JSON-driven GTM configurations, to dynamically load tracking tags without bloating the front end.
<script type=”application/json” id=”AnalyticsConfigurationJSON”>
{“GTM_ID”:”GTM-XXXXX”,”GTM_FRAME_URL”:”https://b.stripecdn.com/stripethirdparty-srv/assets/”,”environment”:”production”}
</script>
This setup reflects the latest trend in performance-first analytics loading—removing non-critical tags from the render path, and managing them via server-side infrastructure or delayed injection. It aligns with the 2025 push toward privacy-first data flows and tag execution control.
Why Use a JSON Config for GTM?
Embedding your GTM config in HTML JSON offers:
- Centralized control over GTM IDs and environments
- Easy swapping between dev/staging/prod configurations
- Support for custom loading URLs (like Stripe’s CDN)
- Less reliance on hardcoded scripts—ideal for agile deployments
- Enables compatibility with Consent Mode v2 and privacy-focused triggers
Pro Tip: This approach improves Largest Contentful Paint (LCP) and Interaction to Next Paint (INP) by reducing synchronous scripts in the main thread.
Step 1: Add Your JSON Config Block
Place this near the end of your HTML file:
<script type=”application/json” id=”AnalyticsConfigurationJSON”>
{
“GTM_ID”: “GTM-AK1111D”,
“GTM_FRAME_URL”: “https://cdn.ayruz.com/gtm-frame/”,
“environment”: “production”
}
</script>
Fallback:
“GTM_FRAME_URL”: “https://www.googletagmanager.com/”
Step 2: Add the JavaScript Loader
Load GTM dynamically based on JSON values:
<script>
(function(){
const el = document.getElementById(“AnalyticsConfigurationJSON”);
if (!el) return;
const config = JSON.parse(el.textContent);
const { GTM_ID: id, GTM_FRAME_URL: url=”https://www.googletagmanager.com” } = config;
if (!id) return;
const s = document.createElement(“script”);
s.async = true; s.src = `${url}gtm.js?id=${id}`;
document.head.appendChild(s);
const ns = document.createElement(“noscript”);
ns.innerHTML = `<iframe src=”${url}ns.html?id=${id}” style=”display:none;visibility:hidden” height=”0″ width=”0″></iframe>`;
document.body.appendChild(ns);
})();
</script>
This mirrors Stripe’s best practices and aligns with 2025’s web performance standards.
Implementing JSON GTM or Server-Side GTM: Which Is Better for Speed?
Both methods significantly improve speed, but they work differently:
JSON GTM Loading:
- Loads GTM script only when needed
- Reduces render-blocking in the
<head> - Ideal for frontend performance and environment flexibility
- Improvement in page speed: 10–20%
Server-Side GTM:
- Moves heavy tracking scripts (GA4, Meta Pixel) to server
- Decreases third-party request overhead
- Enhances data privacy and load speed
- Improvement in page speed: 15–30%
Why Use JSON or Server GTM?
- Use JSON GTM for dynamic script loading without layout shift
- Use Server-side GTM when you want maximum speed, privacy, and scalability
- Combine both for best results: JSON client loader + server-side container
GTM Performance Optimization Techniques for 2025
How Do You Optimize GTM for Better Page Speed?
- Audit tags regularly — Remove old, paused, or redundant tags
- Fire tags conditionally — Use “Some Pages” or specific triggers
- Delay non-critical scripts — Use a timer or window load events
- Switch to server-side GTM — Reduce front-end script load
- Avoid custom HTML bloat — Use lightweight tag templates
- Use preload and prefetch to speed up GTM fetch:
<link rel=”preload” href=”https://www.googletagmanager.com/gtm.js?id=GTM-AK1111D” as=”script”>
<link rel=”dns-prefetch” href=”https://www.googletagmanager.com”>
Real-World Insight: After implementing dynamic JSON GTM loading and deferring non-critical tags, several Ayruz clients saw page load time improve by 15%–30%, especially in First Contentful Paint (FCP) and Largest Contentful Paint (LCP) metrics.
Summary Table — GTM Optimization Checklist
| Optimization Strategy | Benefit |
| JSON-configurable GTM loader | Flexible, environment-aware injection |
| Server-side tagging (sGTM) | Reduces render-blocking scripts |
| Tag delay/timing control | Improves INP & LCP metrics |
| Minified triggers & conditions | Avoids unnecessary DOM load |
| CDN-hosted GTM (like Stripe) | Low latency, fast script execution |
| Consent Mode + Cookieless tags | Future-proof data compliance setup |
GTM Optimization Recap: How Do You Speed Up GTM?
The fastest way to optimize GTM in 2025 is to dynamically load it using a JSON config block, defer non-essential tags, move core tracking to server-side GTM, and preload GTM scripts. This reduces render-blocking, improves Core Web Vitals, and aligns with privacy-first best practices.
Conclusion
Whether running an eCommerce platform, a SaaS product, or a content-heavy website, GTM optimization is critical to your success. Stripe’s method is just one example of how the world’s fastest websites use smart configurations to maintain performance while maintaining tracking accuracy.
Are you looking to implement this at scale? Do you need help with server-side GTM, Facebook CAPI, or GA4 migration? Our team at Ayruz is ready to help.

How to Appear in LLM Results?: The Ultimate Guide to AI Search Optimization in 2025
Large Language Models (LLMs) like ChatGPT, Google Gemini, and Claude reshape how users discover and consume information. Instead of ten blue links, users receive synthesized responses based on multiple sources. This shift makes traditional SEO alone insufficient. To stay competitive, brands must now optimize for AI-generated results by ensuring their content can be understood, retrieved, and cited by LLMs.
What Does It Mean to Appear in LLM Results?
Appearing in LLM results means AI assistants reference or cite your website content when users ask questions. This happens when an LLM chooses a relevant chunk (passage) from your site during its response generation process.
Unlike traditional search engines showing full pages, LLMs rely on passage-level retrieval and synthesis. Therefore, optimizing content for this model requires a new framework.
The Key Differences Between SEO and LLM Optimization
| SEO Focus | LLM Optimization Focus |
|
|
Proven Techniques to Optimize Content for LLM Visibility
1. Optimize for Chunk-Level Retrieval
- Use clear subheadings (H2s, H3s) with question-style formatting
- Write in short, self-contained blocks with one idea per passage
- Avoid long, interdependent paragraphs
Why It Works: LLMs parse pages in smaller blocks (chunks). Each passage must make sense independently.
2. Begin with an Immediate Answer
- Use a direct, concise answer in the first 1–2 sentences under each subheading
- Follow with a brief elaboration or example.
Why It Works: LLMs prefer content that answers a question upfront and expands afterward.
3. Use Schema Markup and Semantic HTML
- Add
FAQ,HowTo, andArticleschema where appropriate
- Use semantic HTML tags (
<article>,<section>,<summary>,<aside>)
Why It Works: Helps LLMs understand page sections, especially when combined with structured Q&A.
4. Write Like You’re Explaining to a Human
- Use conversational tone and natural phrasing
- Avoid passive voice, excessive jargon, or ambiguous references
Why It Works: LLMs generate content to simulate human dialogue. Your input must match that style.
5. Strengthen Topical Authority
- Cover related subtopics, FAQs, and follow-up questions in a single article
- Link internally to related blog posts and guides
- Add statistics, original research, or expert commentary
Why It Works: The more complete and informative your content is, the more likely it will be chosen.
Advanced LLM Content Framework: The QEC Model
Introduce your topic with:
- Question — a user-like query as a subheading
- Explanation — a 2–3 sentence clear response
- Context — examples, stats, visuals, or internal links
Example:
What Is an LLM and How Does It Choose Content?
Large Language Models (LLMs) are AI systems trained on massive text datasets. When answering a question, they pull content at the passage level from credible and transparent sources. LLMs prefer passages that use natural language and are semantically structured.
What Content Types Are Most Favored by LLMs?
- FAQ pages with schema
- Comparison articles (e.g., “GA4 vs Universal Analytics”)
- Tutorials or how-to guides with structured steps
- Articles that answer “why”, “how”, and “what” in subheadings
- Summary or trend-based articles with stat-backed insights
Additional Tips to Appear in Both LLM and Traditional SERPs
- Use
People Also Askquestions as section headers - Include internal anchor links and jump menus
- Use a featured snippet format: answer, detail, list
- Monitor crawlable text—avoid hiding answers in images or JS
- Optimize images with descriptive alt tags
Tools to Help You Test and Improve LLM Visibility
- ChatGPT / Gemini — Prompt AI tools with your keywords and test if your content is surfaced
- Surfer SEO / Frase.io — Build outline based on PAA and NLP questions
- Ahrefs / Semrush — Track passage-level queries and topic gaps
- Rich Results Test — Verify schema and structured data compatibility
🔗 Google’s Search Central – AI content guidelines
Real-World Example: LLM Visibility Test
A client at Ayruz updated an article using chunked headings, direct answers, and internal linking. Within 3 weeks, their content was quoted by Gemini in at least 3 test prompts related to their niche. Impressions on AI-powered browsers increased by 40%.
Final Checklist for LLM Optimization
| Task | Purpose |
| H2 with user-style questions | Matches prompt pattern |
| Short, direct answers first | LLMs prefer top-loaded clarity |
| Break long content into chunks | Supports passage-level recall |
| Add FAQ/HowTo schema | Structured data enhances interpretation |
| Add original stats or quotes | Increases credibility and authority |
| Use a conversational tone | Matches LLM output style |
Final Takeaway: Why LLM Visibility Is the Future of SEO
To rank in 2025, you need to think like an AI assistant. Focus on structured, clear, direct content optimized for chunk-level retrieval—not just keywords. Appearing in LLM answers is the new front page of the web.
Do you need help optimizing your site for LLM search and AI visibility? Our team at Ayruz can help you write, structure, and validate content that AI tools love.

How Ayruz helped Oldcastle Infrastructure to create a new user experience for their CPQ-based customer portal?
Oldcastle Infrastructure is the leading provider of engineered products and accessories for building and construction in the USA. They are part of CRH Plc (LSE: CRH), the world’s leading building materials business. Together, they go beyond their products and services and bring value to the community, building not just physical structures but also a better society.
Keeping in mind the core business and values of Oldcastle, Ayruz USA collaborated with the Oldcastle team to build a tool aligned with these goals.
The objective:
Ayruz advantageously brings industry knowledge and an in-depth understanding of the client’s business and how to improve the metrics that matter, keeping the client’s overall business objectives central. With that in mind, the CPQ tools and everything that tags along with it became a solution mastered by the Ayruz team, facilitating teamwork, improving customer experience, and accelerating the process that usually takes more time and effort.
Oldcastle had a legacy configurator portal in which customers could make product configurations, but the users were facing numerous issues in accomplishing their needs. With that in mind, Ayruz weaved a strategy that:
- Understands and resolve bad user experiences;
- Address key customer needs with the new Portal;
- Look through the customer lens and understand their behavior. We practice the “Think like a Customer” mindset, understand the manufacturing activities, the products, their application, the information customers seek before purchasing these tools, and map the consumer journey in its entirety;
- Navigation that enables the guided purchase of stormwater products;
- Develop best practices, guidelines;
- Execute UX, UI, and layout best practices;
- Capture and track leads via Salesforce;
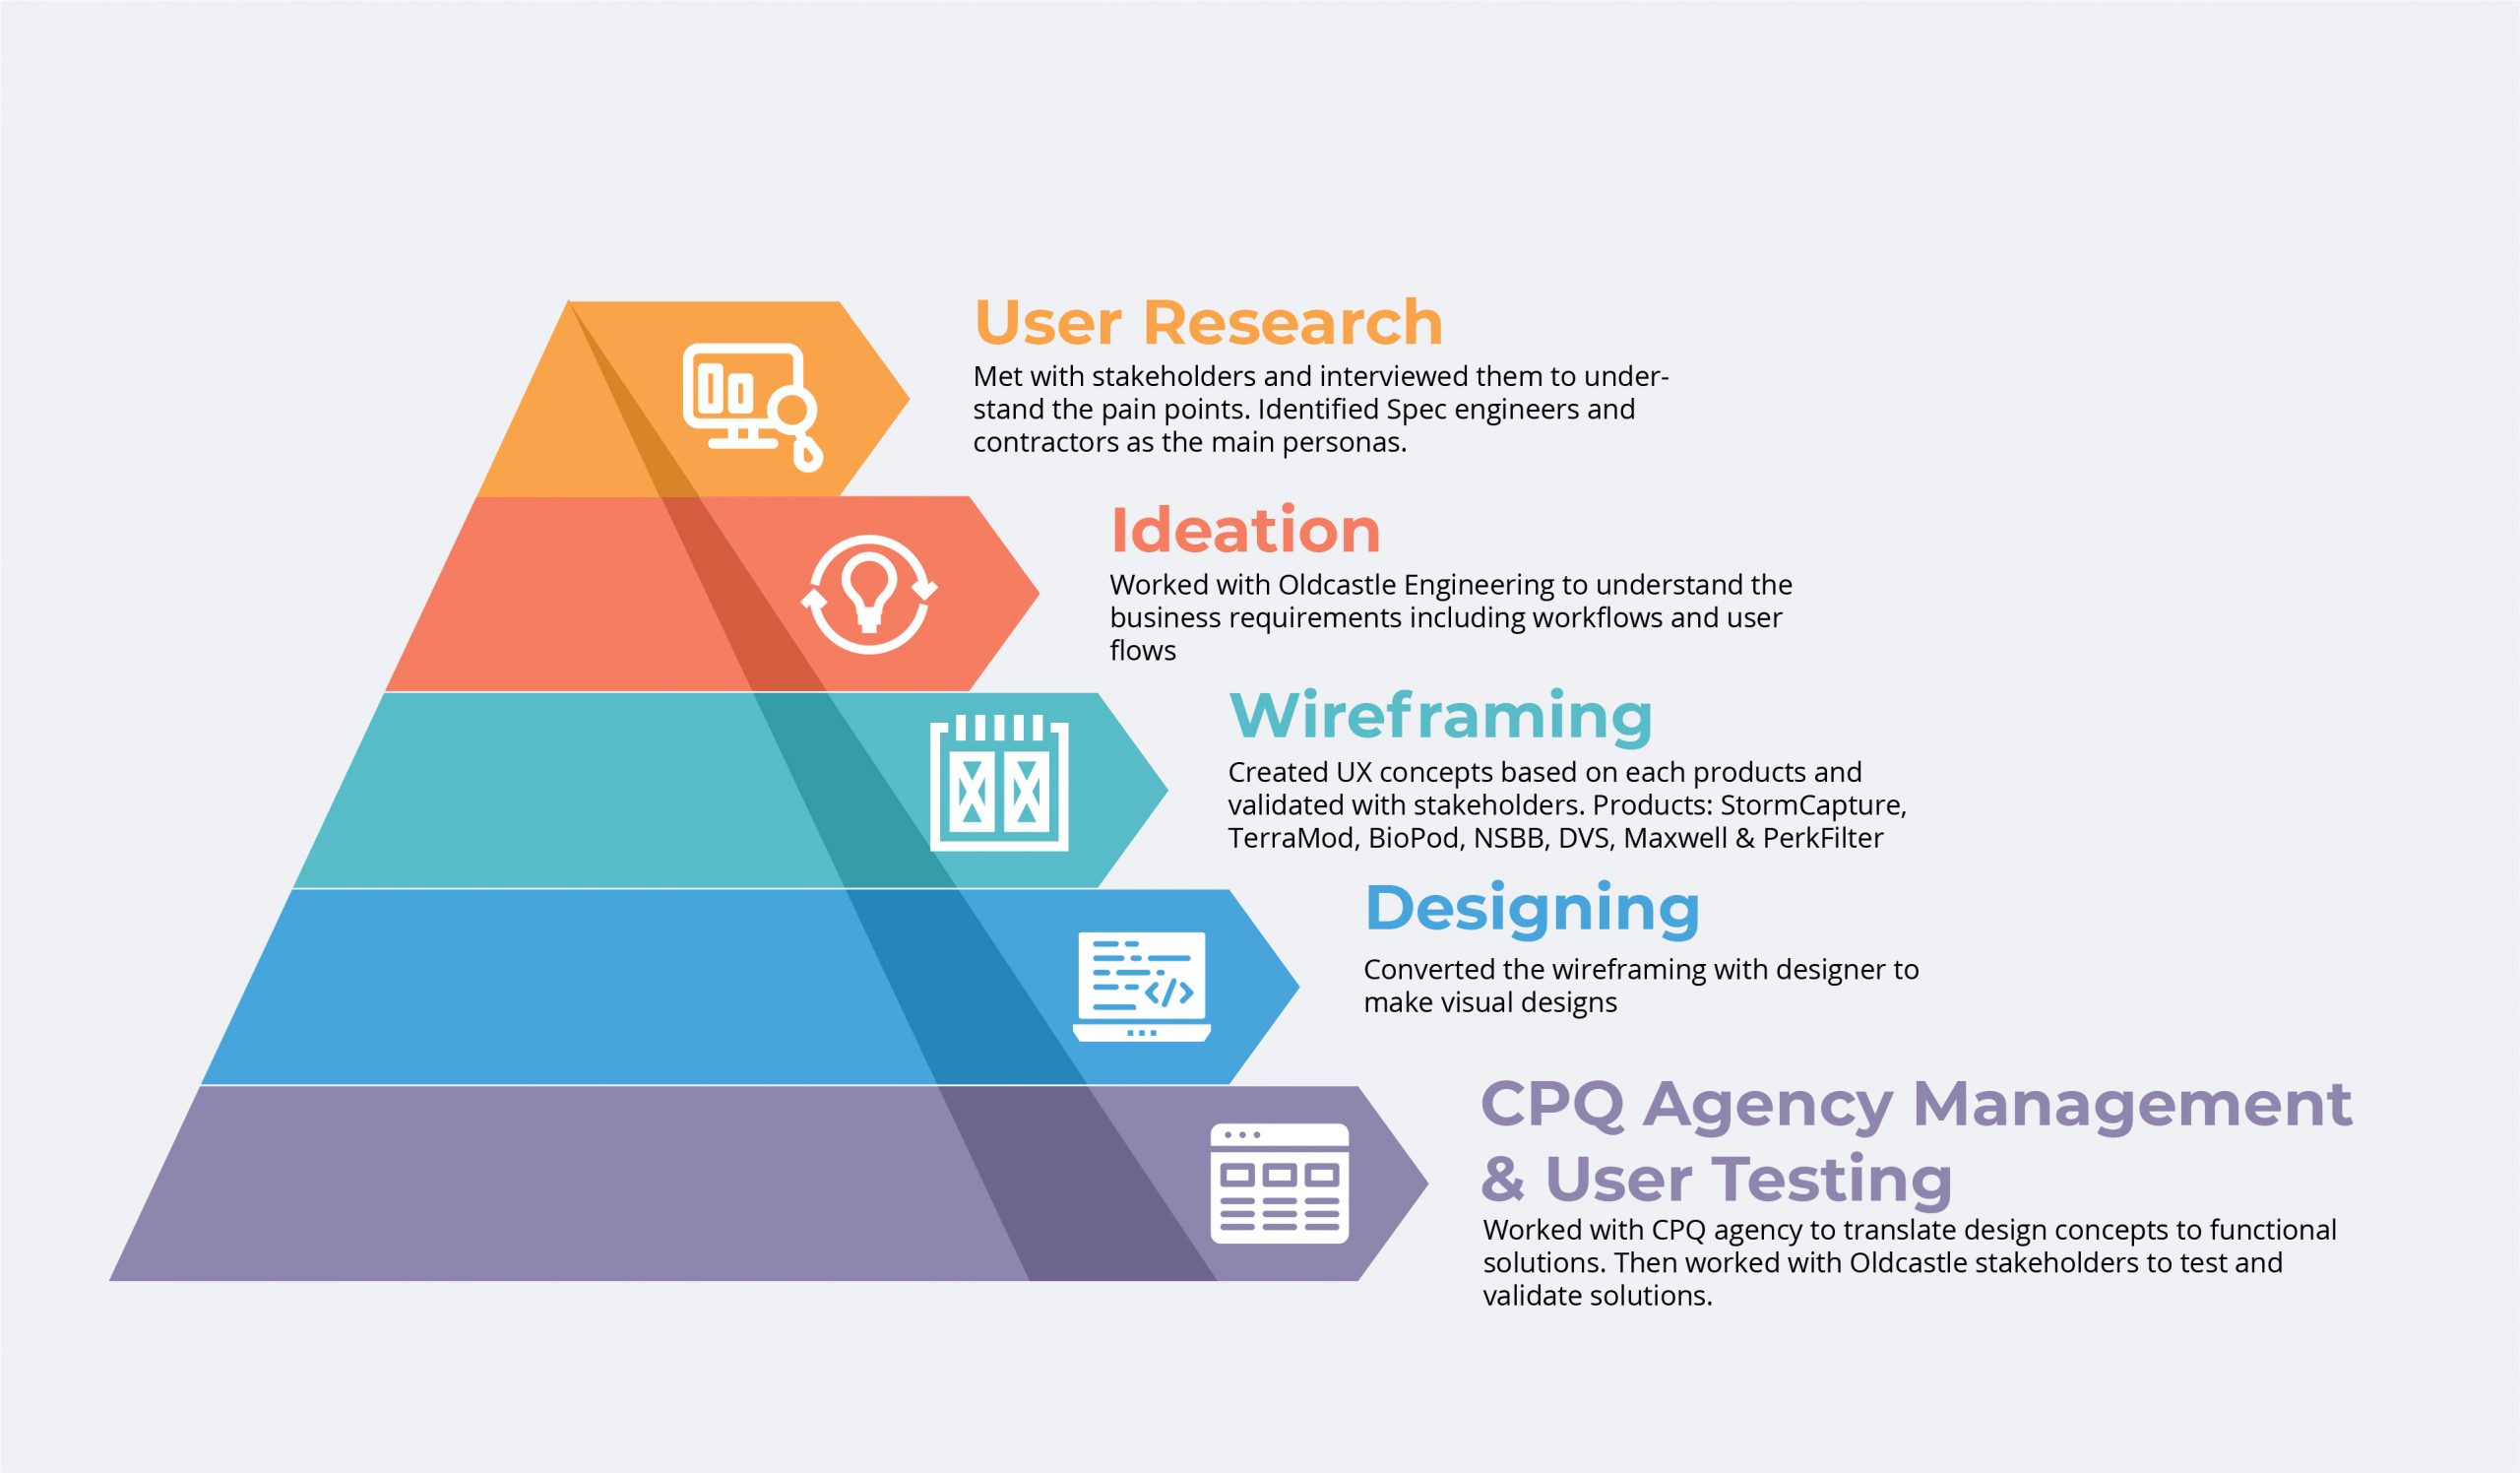
The Process:
To start this project, Ayruz first interviewed stakeholders and understood their experience with the existing Portal and their pain points; then, it was necessary to talk to Oldcastle Engineers to understand the business requirements and acquires the knowledge to understand and build a better Portal based on their workflows and user flows.
To come up with the best solution, Ayruz created a UX concept based on product specificities and validated the design work with stakeholders. Wireframes were presented during the whole project, bringing visual designs in all steps of development and continuous work along with the CPQ agency to translate design concepts into functional solutions.
A weekly meeting with Oldcastle stakeholders ensured everybody was on the same page during the entire project by testing and validating the solutions. The customer-centric project had expectations, and Ayruz made sure to meet them.
Top-down user experience approach
The experience Ayruz delivered on the Portal on the Oldcastle website speaks for itself.
To illustrate further, Ayruz started with the User Dashboard, giving the customer the possibility to easily see and follow their many projects:
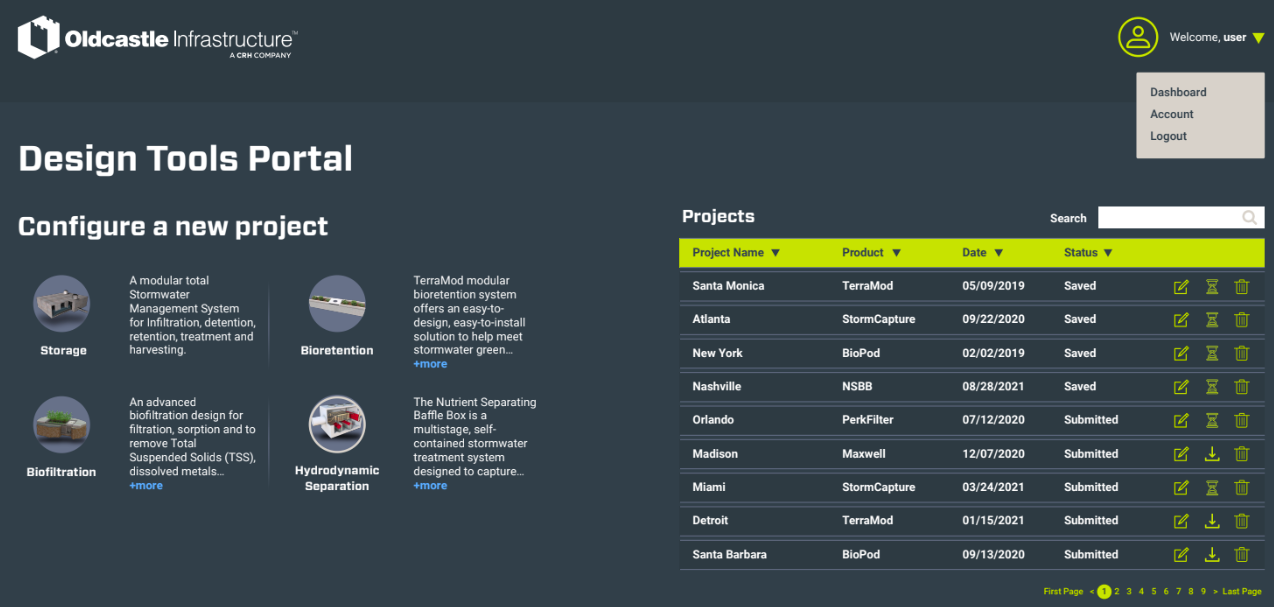
Based on the Customer Portal Experience Ayruz designed a Dashboard focusing on the user needs.
After having identified the user need, a System Parameter (Image from Maxwell Tool) was also developed and designed accordingly:
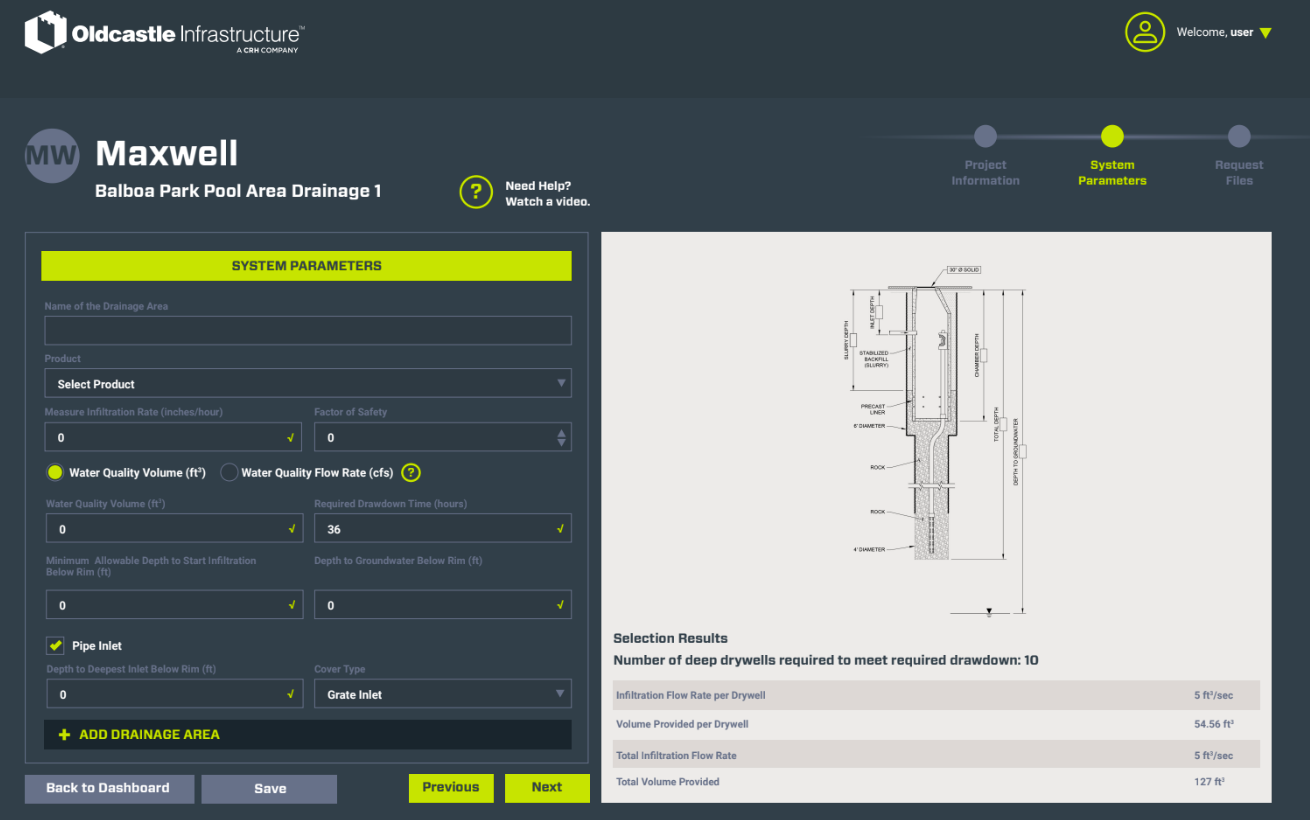
It is essential to mention that Ayruz not only did the user-centric layout, UX and UI, but the Ayruz team had knowledge about the complex engineered Tools functionalities and their applications. That means that every box included in this System Parameters is based on the customer’s needs: to know about the water quality volume, the flow rate, minimum allowed depth, and compliance particularities of each state.
It is not just about what we can see in the pages developed for Oldcastle Infrastructure; it is also about the mindset behind it, compliance rules for each region, and tools parameters for customers’ buildings and construction.
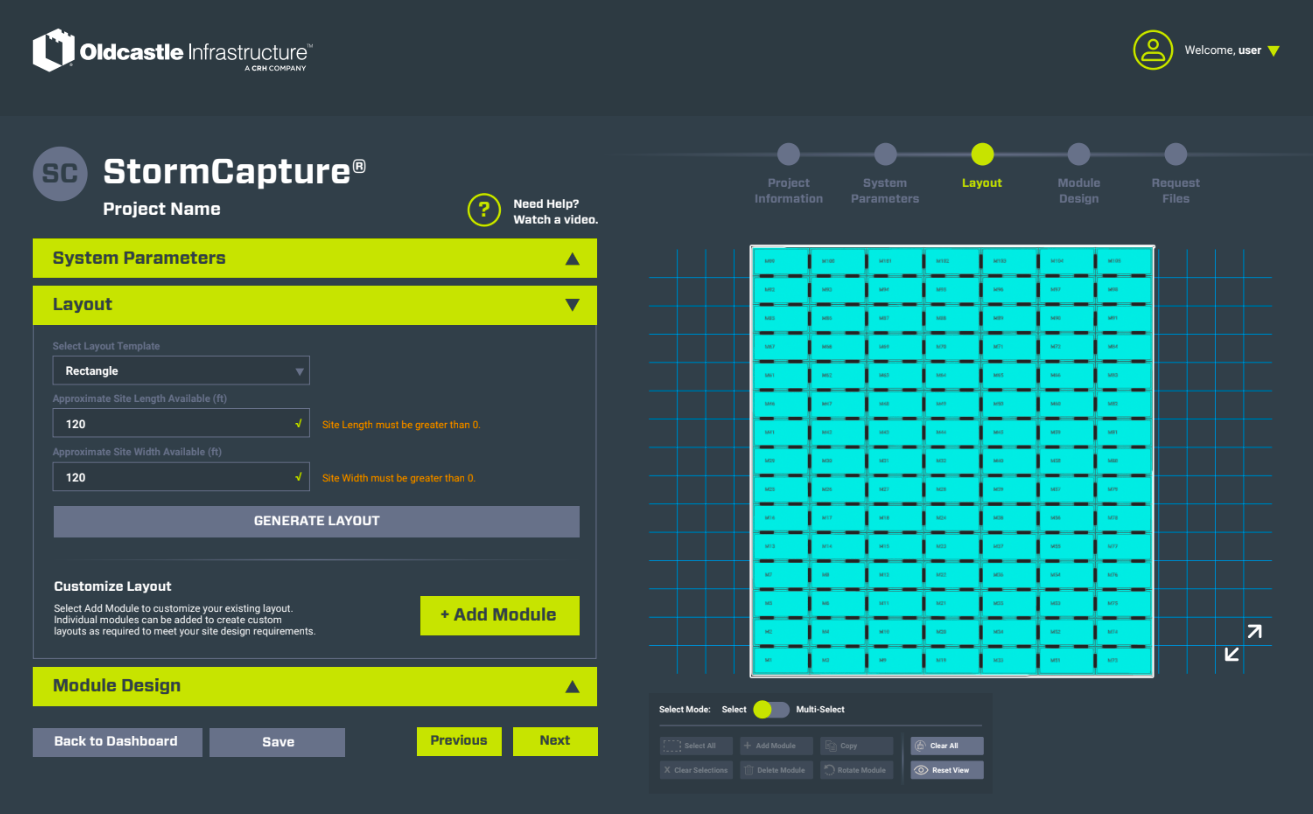
Layout (Image from StormCapture Tool)
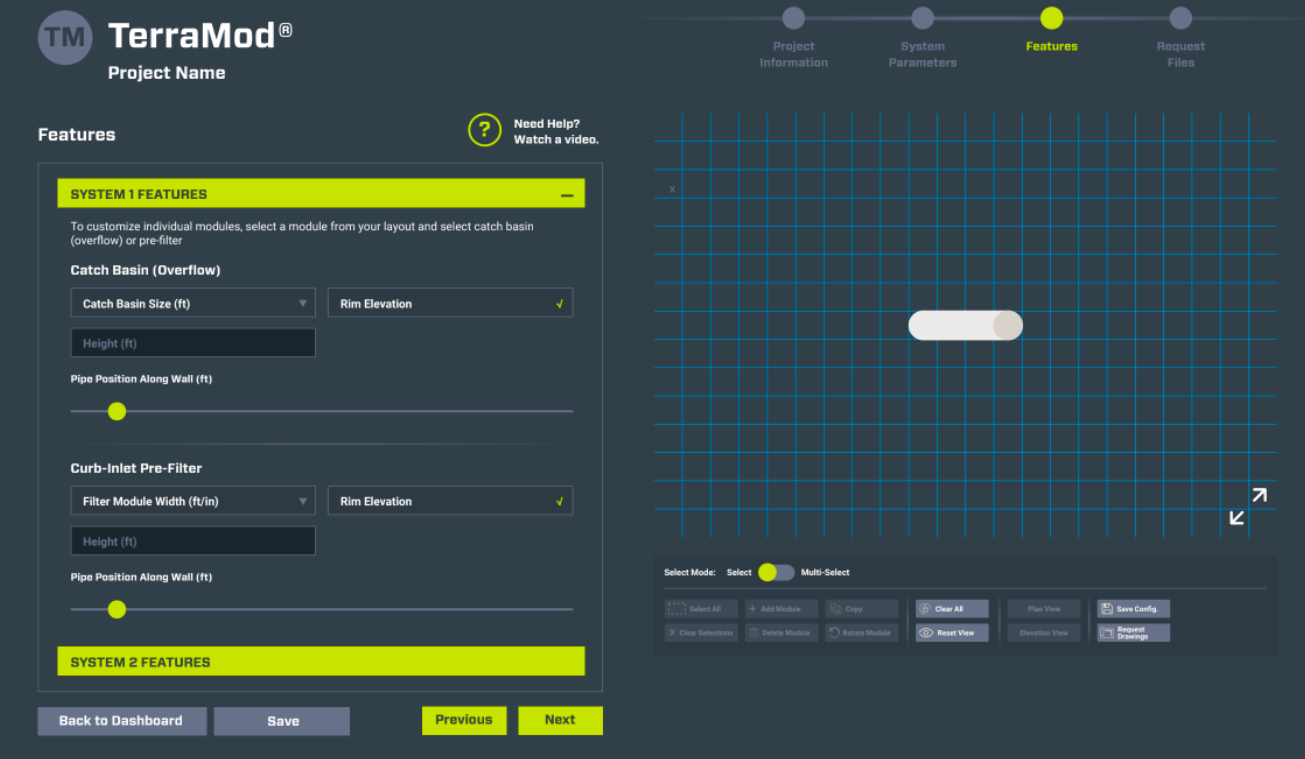
Features (image from TerraMod tool)
Like every project Ayruz undertakes, we take ownership and go well beyond the finishing line.
The goal was to revamp a legacy configurator Portal for customers, and Ayruz deep-dived into it. In the end, the selling of products and capturing/tracking leads through Salesforce exceeded customer expectations.
The bottom line is, Ayruz doesn’t merely treat the customer or a project in a typical sense. Instead, Ayruz works closely as a partner with industry and business experience. And in this case, Ayruz did not just build a Customer Portal, but a Customer and Sales Solution, a productive system with a quality layout, adding value to all the stakeholders involved with the tool.
Social Media Post from Oldcastle
Testimonial

Mark Skinner, Sr Manager Digital Marketing
“Ayruz has been our partner leading the UI/UX design for our newly enhanced suite of CPQ digital tools. Sanil and his team have a deep understanding of our manufacturing industry and is familiar with the complexity of our products. Ayruz has been instrumental to the design of our tools allowing our customers to configure their products to meet jobsite requirements, and deliver an overall outstanding digital experience.”
Main Highlights:
Goal
To develop a new Portal that has all the customers’ needs attended to, understanding not only Oldcastle core business, but also their customer’s behavior and their journey in entirety.
Partnership
Oldcastle Vendor since 2021
Industry’s most complete and user-oriented Portal
User-centric design, UX, and UI. Enable faster customer quotation and access to quality information, accelerating and simplifying the process for the Sales team. A work tool for both sides: customers and the business.
If you are looking for a vendor for your digital needs who understands your industry, business, and goals and who comes with a partner mindset, you can talk to us at Ayruz to discern the value we bring.
We dedicate time to understanding your activities and needs, putting your customers in the center, and then bringing you solutions to the problems and helping execute them. Talk to us for a free consultation.
From VOC, and VOS, to developing portals, revamping websites to digital strategy, marketing data intelligence, and planning, Ayruz brings a 360º overview of your business and helps accelerate your growth by leveraging digital.

Universal Analytics to Google Analytics 4 Migration and its common mistakes
One significant transition many businesses are currently undertaking is migrating from Universal Analytics to Google Analytics 4 (GA4). Google Analytics 4 is the latest version of Google’s analytics platform, providing businesses with enhanced features and benefits.
Here is the step-by-step process for seamlessly migrating from Universal Analytics to GA4.
Step 1: Familiarize Yourself with GA4 Before starting the migration process, it’s essential to understand the critical differences between Universal Analytics and GA4. GA4 is more customer-centric, focusing on events and user interactions rather than page views. In addition, it offers enhanced cross-platform tracking, machine learning-powered insights, and a privacy-centric approach. Familiarize yourself with the new terminology and concepts in GA4, such as data streams, events, and parameters, to ensure a smooth transition.
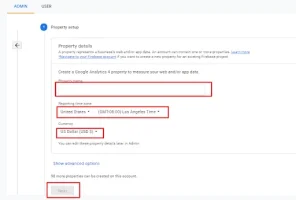
Step 2: To set up a new GA4 property to migrate to GA4, we must create a new property in the Google Analytics account; it will allow data collection in GA4 while maintaining the existing Universal Analytics property for historical data. First, open your Google Analytics account and navigate to the Admin section. Under the Property column, click on “Create Property” and select “Web” or “App” depending on the platform—the new GA4 property, including configuring data streams and defining the measurement settings.
Step 3: After setting up the GA4 property, you must update the tracking code on the website or app to send data to GA4. You can achieve this by using Google Tag Manager. The tracking code format of GA4 differs from that of Universal Analytics. Thus, it is necessary to substitute the current tracking code with the new GA4 tracking code. The process may demand alterations to the website’s code or the app’s SDK. If required, involve the development team. Ensure to thoroughly test the updated tracking code and ensure the data is collected accurately in GA4.
Step 4: Configure Data Streams and Events Data streams and events are the foundation of tracking data in GA4. Data streams allow us to define specific data sources or streams, such as website traffic or app usage, and events are the actions or interactions we want to track, such as page views, clicks, or conversions. Configure the data streams and events in GA4 based on the business objectives and tracking requirements. We can use the GA4 interface or the Measurement Protocol to send events directly to GA4 from the website or app.
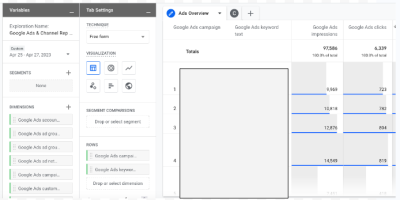
Step 5: Set Up Custom Reports and Dashboards; GA4 offers a new reporting interface with updated features and visualization options. Take advantage of setting up custom reports and dashboards that align with the specific goals and metrics. This may involve recreating or modifying the existing Universal Analytics reports suiting the GA4 reporting format. In addition, utilize GA4’s machine learning-powered insights and data visualization options to gain meaningful insights and share reports with the team and stakeholders.
Step 6: Monitor and Optimize After migrating to GA4, monitoring the data and optimizing the tracking settings is crucial. Review the data regularly to ensure that it is accurate and meets expectations. Take advantage of GA4’s advanced features, such as machine learning-powered insights and predictive modeling, to uncover new opportunities for optimization. Continuously refine the tracking strategy based on data-driven insights and make adjustments as necessary to improve the analytics performance.
List of common mistakes to avoid during the UA to GA4 migration process:
- Not planning for data loss: The data model of GA4 differs from UA, implying that GA4 will not automatically transfer all UA data. For example, GA4 may not have direct equivalents to UA’s custom dimensions, metrics, and segments and may not retain historical data entirely. It’s vital to thoroughly review the differences between UA and GA4 data models and plan for potential data loss or discrepancies during migration.
- Neglecting to update tracking code: GA4 requires a different tracking code format than UA. One common mistake is not updating the website or app tracking code to the new GA4 format, which can result in data collection issues and incomplete or inaccurate reporting in GA4. It’s vital to update the tracking code on all relevant pages or apps during migration.
- Neglects to set data retention: In GA4, you can configure data retention settings to determine how long the GA4 property will retain user-level and event-level data. If you do not set up the data retention settings correctly, the data may get automatically deleted after the default retention period of 14 months. This can lead to losing important historical data and hinder the ability to perform long-term analysis, track trends, or compare data over time. It’s important to review and set data retention settings according to the organization’s policies to ensure that valuable data is retained for the desired period and remains accessible for analysis and reporting purposes.
- Setting up where to store raw data: GA4 allows one to choose between two options for keeping the raw data: BigQuery, a cloud-based data warehouse, or the default storage in GA4. Storing raw data in the default GA4 storage, which has limitations on data access, analysis, and customization, can happen if you do not configure this setting correctly. Storing raw data in BigQuery provides more flexibility and scalability for advanced data analysis, custom data queries, and data integration with other business intelligence tools. It’s important to carefully consider and configure the storage location for raw data in GA4 to ensure that it aligns with the organization’s data strategy and enables efficient data analysis and utilization.
- Duplicate tags: GA4 allows to set up tags, which are snippets of code that collect data from the website or app and send it to GA4 for analysis. However, mistakenly duplicating tags can lead to data discrepancies and inaccurate reporting. Implementing the same tag multiple times on a page or app can send duplicate data to GA4, inflating metrics and providing incorrect insights. Additionally, duplicated tags can cause conflicts, such as multiple tags firing simultaneously, resulting in data loss or incomplete data capture. It’s essential to carefully review and manage the tags in GA4 to avoid duplications, ensure accurate data collection, and maintain reliable reporting for effective data-driven decision-making.
- Overlooking data governance and privacy considerations: GA4 includes additional data governance and privacy features, such as the ability to configure data deletion, consent settings, and data retention periods. Failing to configure these settings during the migration process properly can result in non-compliance with data protection regulations or incorrect data handling, which can have legal and reputational implications.
- Not reviewing and updating existing integrations: If you have third-party integrations with GA, such as CRM systems, advertising platforms, or other data sources, it’s important to review and update these integrations during the migration to GA4. Some integrations may require updates or modifications to work with GA4, and failing to address these changes can result in data gaps or discrepancies in the reporting.
- Not updating reporting and analysis processes: GA4 introduces new features and changes to reporting and analysis compared to UA. One common mistake is not updating internal processes and training materials for reporting and analysis to reflect these changes. Educating the team on the differences between UA and GA4 reporting and analysis and updating any documentation or training materials accordingly is essential.
- Skipping testing and validation: As with any migration, it’s crucial to thoroughly test and validate data in GA4 after the migration process to ensure accuracy and reliability. Skipping this step can result in missed data discrepancies or inaccuracies that may go unnoticed. Conduct thorough testing and validation of the GA4 data to ensure it aligns with the expectations and business requirements.
If you’re working with a GA4 agency to migrate from UA to GA4, it’s essential to communicate with them about these common mistakes to ensure they are avoided during the migration process. Collaborating with a GA4 agency can provide expert guidance and support throughout the migration process, but it’s still important to be aware of potential pitfalls. Avoiding these common mistakes and carefully planning and executing the migration process can help ensure a smooth transition from UA to GA4 and maximize the value of the analytics data in the long run. With the right approach and support from a GA4 agency, you can make the most of this powerful analytics platform and unlock new insights into your business.
Universal Analytics vs Google Analytics 4: A Comparison
Web analytics has become essential to digital marketing, helping businesses gain insights into their website’s performance and user behaviour. With the evolution of analytics platforms, Google has introduced a new version called Google Analytics 4 (GA4), which brings significant changes compared to its predecessor, Universal Analytics. Here, we will explore the differences between Universal Analytics and GA4, focusing on key points such as app tracking, hit types, session calculations, exports to BigQuery, bounce rate and engagement rate, the importance of Google Tag Manager, and account structure.
- App Tracking: One of the significant differences between Universal Analytics and GA4 is the ability to track apps. While Universal Analytics primarily focuses on web tracking, GA4 provides enhanced app-tracking capabilities. GA4 allows businesses to track user behaviour within their mobile apps, including in-app events, screen views, and conversions. This feature enables businesses to gain insights into user engagement and retention within their apps, making GA4 a more comprehensive analytics solution for businesses with mobile apps.
- Hit Types: Hit types are how data is sent to Google Analytics for measurement. In Universal Analytics, hit types include pageviews, events, social interactions, e-commerce transactions, and more. However, in GA4, the concept of hit types has been simplified and replaced with events. Events in GA4 can capture various interactions, including pageviews, clicks, video views, scroll depth, and more. This streamlined approach allows for easier implementation and more flexibility in tracking user interactions.
- Session Calculations in GA4 vs Universal Analytics: Sessions are the periods of time in which users interact with a website or app. In Universal Analytics, a session is defined by default as 30 minutes of inactivity or the end of the day. However, in GA4, the concept of sessions has changed. GA4 uses an event-based model, where a session is a collection of user interactions with the same session ID, regardless of the time interval between interactions. This means that in GA4, a session can span across multiple days, making it more flexible and better suited to track user behavior in the modern multi-device, multi-channel digital landscape.
- Exports to BigQuery are free with Google Analytics 4: Another notable difference between Universal Analytics and GA4 is the ability to export data to BigQuery, Google’s cloud-based data warehouse, for advanced analysis. In Universal Analytics, exporting data to BigQuery requires a paid integration with Google Analytics 360. However, in GA4, data exports to BigQuery are free, making it more accessible for businesses to analyze and gain insights from their data in a powerful and scalable data warehousing solution.
- Bounce Rate and Engagement Rate: Bounce rate is a metric that measures the percentage of users who leave the website after viewing only one page, while engagement rate measures the level of user interaction on a website. In Universal Analytics, these metrics are calculated based on pageviews, while in GA4, they are calculated based on events. This means that in GA4, businesses can have more accurate and granular insights into user engagement. Events can capture interactions beyond pageviews, such as clicks and video views.
- Google Tag Manager is more important than ever: Google Tag Manager (GTM) has always been a valuable tool for managing tracking codes and implementing analytics on websites and apps. However, with the introduction of GA4, GTM has become even more important for businesses that want to make the most of their data-driven strategies.
One of the key reasons why GTM has gained increased importance with GA4 is the shift toward an event-based tracking model. In GA4, events are the primary data points tracked, replacing traditional pageviews and other hit types in Universal Analytics. Businesses must carefully configure and manage their events in GTM to ensure accurate tracking of user interactions, conversions, and other important events.
GTM also allows businesses to implement GA4’s enhanced app tracking capabilities easily. With GA4, businesses can track user interactions within their mobile apps, such as button clicks, in-app purchases, and app opens. GTM simplifies adding event tracking codes to the app’s source code, making it easier for businesses to implement and manage app tracking in GA4.
Furthermore, GTM allows businesses to adapt and update tracking configurations without changing their website or app’s source code. This means businesses can easily update their tracking setup, add new events, and make other changes as needed, all through the GTM interface, without requiring developer involvement. This agility and flexibility make GTM a powerful tool for businesses that want to quickly iterate and optimize their tracking setups based on their evolving data needs.
In addition, GTM offers a robust testing and debugging environment, which is essential for ensuring that tracking codes are working correctly and data is accurately captured in GA4. Businesses can use GTM’s built-in preview and debug mode to test their tracking configurations and troubleshoot any issues before deploying changes to their live website or app.
Overall, GTM has become more important than ever with GA4, providing businesses with the necessary flexibility, agility, and testing capabilities to implement and manage their event-based tracking setup effectively. It allows businesses to efficiently configure and deploy tracking codes, test and debug tracking configurations, and adapt their tracking setups. It is a crucial tool for businesses that want to maximize the benefits of GA4’s advanced analytics capabilities.
- Better Search With the GA4 Search Bar: Another notable feature of GA4 is including a search bar within the platform. This search bar allows users to easily search for specific events, conversions, or other data points within their GA4 account, making finding relevant information more efficient and convenient. This feature is particularly useful for businesses with large amounts of data or complex tracking setups. It allows for quicker and more precise searches, making data analysis and reporting more streamlined.
- Account Structure: The account structure in GA4 has also been updated compared to Universal Analytics. Universal Analytics’s account structure consists of accounts, properties, and views. However, GA4’s account structure is simplified to just organizations and properties. Organizations serve as top-level entities and can have multiple properties representing the websites, apps, or other tracked digital assets. This updated account structure gives businesses a more streamlined and organized approach to managing their analytics properties, making setting up and managing to track multiple assets easier.
Conclusion: If you’re considering switching to GA4, partnering with a GA4 agency can help you navigate the complex migration process and fully leverage the platform’s capabilities. In conclusion, GA4 introduces significant changes and improvements compared to Universal Analytics. With enhanced app tracking capabilities, streamlined hit types, event-based session calculations, free exports to BigQuery, updated metrics like bounce rate and engagement rate, the increased importance of Google Tag Manager, and improved search capabilities within the platform, The web analytics approach provided by GA4 is more modern and comprehensive in comparison to Universal Analytics. However, the transition from Universal Analytics to GA4 may require businesses to adapt their tracking setups and familiarize themselves with the updated features and account structure. A GA4 agency can provide guidance and expertise to ensure a smooth transition and help businesses fully leverage the capabilities of GA4 for their data-driven decision-making. To fully utilize GA4’s potential, companies must thoughtfully evaluate their particular needs and preferences when deciding between Universal Analytics and GA4 and plan a seamless transition accordingly.
How is bounce rate calculated in GA4 and what replaces the bounce rate in GA4?
Analyzing website performance has always involved a crucial metric – bounce rate. But with the arrival of Google Analytics 4 (GA4), things have changed., there have been significant changes in how bounce rate is calculated and interpreted. In this article, we will explore the revised method of calculating bounce rate in GA4 and discuss the new metric that replaces it.
What is Bounce Rate?
The bounce rate is a metric intended to indicate the level of engagement among visitors to your website. In Analytics, a bounce occurs when a visitor arrives on your website but doesn’t navigate to other pages before leaving. The higher the bounce rate, the worse it is.
For example: Let’s say you have four visitors to your website. Two of them only look at one page each and leave, while the other two explore two pages each before leaving. In this case, your bounce rate would be 50%. Half of the visits resulted in only a single page view.
- The bounce rate is the percentage of website visits where users only viewed one page and did not interact further or request additional information from the Analytics server.
- An engagement event is any event that indicates user interaction with your website or app.
- You can define these events, consisting of various actions such as viewing pages, clicking on elements, submitting forms, playing videos, and more.
- By default, the engagement events in GA4 include page_view, scroll, search, and ad_click.
Traditionally, in previous versions of Google Analytics, bounce rate was calculated based on a single-page session, where a user’s interaction was limited to a single pageview.
How is the bounce rate calculated in GA4?
GA4’s approach to measuring bounce rate has undergone a fundamental shift. Instead of relying solely on single-page sessions, GA4 introduces a more nuanced concept known as “engaged sessions.” To calculate the Bounce rate in GA4, divide the number of single-engagement sessions by the total number of sessions and multiply by 100 to get the percentage.
Bounce Rate = (Single-engagement sessions / Total sessions) * 100
Engaged Sessions and Bounce Rate: An engaged session in GA4 is where a user interacts with the website or app for a certain duration or performs an event that indicates active engagement. This includes scrolling, clicking on a link, playing a video, or submitting a form. Consequently, a session with a single pageview can still be considered an engaged session if the user spent a significant amount of time on that page or completed a valuable action.
What replaces the bounce rate in GA4?
- In Google Analytics 4 (GA4), the concept of bounce rate used in Universal Analytics is replaced by the concept of engagement rate.
- In GA4, the concept of a “bounce” is different from Universal Analytics. In Universal Analytics, a bounce was recorded when a user only viewed a single page of your website. In GA4, a bounce is recorded when a user exits a session after a single engagement event, regardless of the number of pages viewed.
- When GA4 was introduced, a new metric called engagement rate was also introduced. In simple terms, the bounce rate is the opposite of the engagement rate (100% – engagement rate).
- Remember that GA4 provides a more event-driven and flexible approach than Universal Analytics, and you can define your own engagement events based on your specific tracking needs.
What is the Engagement rate in GA4?
- The engagement rate is a valuable metric for evaluating the effectiveness of your content, user experience, and overall website/app performance in terms of engaging and retaining visitors. It helps you identify areas where user engagement can be improved and informs strategies for enhancing the user experience.
- It provides insights into how actively users engage with your content beyond single-page visits.
- By considering both the duration of the session and the occurrence of multiple engagement events, GA4’s engagement rate provides a more comprehensive understanding of user engagement and involvement compared to the traditional bounce rate. A higher engagement rate indicates that users actively interact with your website or app, explore multiple pages, spend more time, and potentially take desired actions, such as conversions or completing goals.
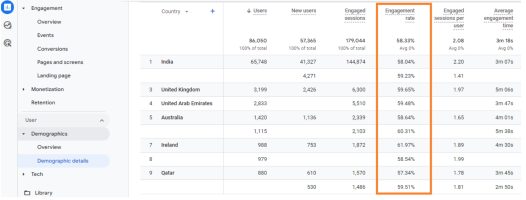
- In Google Analytics 4, you can locate the engagement rate within some of the default reports.
For example:
- Navigate to “Demographic Details report”. If you have linked Google Search Console, you can find the engagement rate metric in the “Google Organic Search Traffic” report.
- Interestingly, it is not included in the default ‘Pages and Screens’ report or the ‘Engagement Overview’ report. However, you can customize these reports and add the engagement rate metric if you have edit or admin-level permission.
Below is a Comparison table between bounce rate in Universal Analytics (UA) and engagement rate in Google Analytics 4:
| Metric | Bounce Rate (UA) | Engagement Rate (GA4) |
|---|---|---|
| Definition | Percentage of sessions with a single engagement event (e.g., single-page sessions) | Percentage of sessions with multiple engagement events |
| Calculation | (Single-engagement sessions / Total sessions) * 100% | (Engaged sessions / Total sessions) * 100% |
| Focus | Measures lack of user interaction or single-page visits | Measures user interaction and multiple engagement events |
| Duration | Doesn’t consider session duration | Considers session duration as a factor of engagement |
| Events | Considers a limited set of predefined events (e.g., page views, scrolls) | Can include a wide range of custom-defined events and interactions |
| Interpretation | Higher bounce rate indicates lower engagement or unsatisfactory user experience | Higher engagement rate suggests active user involvement and interaction |
| Enhanced Insight | Limited view of user behavior and engagement | Provides a more comprehensive understanding of user interactions and involvement |
| Migration | UA data and reports don’t directly translate to GA4’s engagement rate | Bounce rate data can be analyzed alongside engagement rate to compare metrics |
A few more alternatives can be used:
VIEWS PER USER: The ‘Views Per User’ metric helps understand how frequently people interact with each page on your website on average. Let’s take an example: If a person visits your home page, then goes to your contact page, and later returns to the home page, the home page would have received two views. On the other hand, if another person visits your home page and leaves without viewing any other page, it would count as one view for the home page. In this scenario, we would have three views of the home page (two from the first person and one from the second) and two users. To calculate the ‘Views Per User’ for the home page, we divide the total number of views (three) by the number of users (two).
3 views / 2 users = 1.5 views per user
AVERAGE ENGAGEMENT TIME: It provides insight into the average duration people spend on each page. It is a useful metric, especially when you anticipate visitors will find all the necessary information on a single landing page.
UNIQUE USER SCROLLS: It indicates the number of individuals who have scrolled through at least 90% of a page. It provides an understanding of the engagement level and shows how many users have interacted with the content by scrolling down the page.
How to add bounce rate to standard reports in Google Analytics 4?
Assessing your bounce rate in GA4 can be a bit challenging:
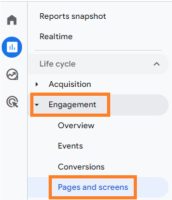
- First, go to the Reports on the left tab. Then, click > Engagement > Pages and screens.
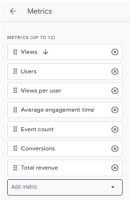
- To personalize the report, click on the edit icon at your screen’s upper right corner. This will bring up a sidebar on the right side of the icon. Select >Metrics. It will show the default metrics included in the Pages and screens report. Click Add metric at the very bottom.
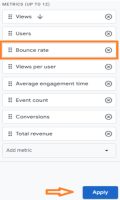
- Select “Bounce rate.” Click and drag the “Bounce rate” label to move it up so that it’s one of the first columns (refer the image below). Then, click “Apply.”
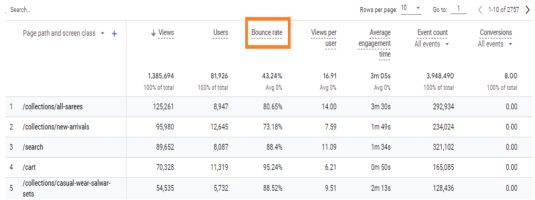
- The bounce rate is now reflected in the report. So, click > Save > Save changes to current report > Save.
- You can now verify that you have effectively personalized the standard report by adding the bounce rate.
Conclusion:
GA4’s revised approach to measuring bounce rate, as part of GA4 implementation, brings a more nuanced and insightful perspective on user engagement. By shifting the focus from single-page sessions to engaged sessions, GA4 better understands how visitors interact with a website or app. In addition, the introduction of metrics such as Engagement Rate and Engagement Time provides a more comprehensive analysis of user behavior, enabling businesses, with the assistance of a GA4 Agency, to optimize their digital experiences and drive meaningful engagement with their audience.
.webp)
How to Configure Google Analytics 4 in Google Tag Manager
Introduction
In the intricate world of web analytics, the integration of Google Analytics 4 (GA4) with Google Tag Manager (GTM) stands as a beacon of efficiency. But, a common question lingers: “Do you need Google Tag Manager with GA4?” Let’s unravel the answers as we delve into the steps of configuring GA4 in GTM.
Do You Need Google Tag Manager with GA4?
Before we jump into the how-tos, let’s address the crucial question. Yes, you need Google Tag Manager with GA4, and here’s why. GTM acts as the facilitator, simplifying the implementation of various tags, including GA4. It streamlines the process, making it more manageable and less prone to errors.
How to Add GA4 to Google Tag Manager
Now, let’s get our hands dirty with the steps to seamlessly configure GA4 within GTM.
Step 1: Create a Google Analytics 4 Property
- Log In to Google Analytics: Begin by logging into your Google Analytics account. If you’re new to the game, create an account and set up a property specifically for GA4.
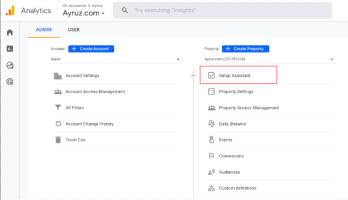
- Access GA4 Property: Locate the GA4 property and click “Set up GA4.” This initiates the setup process.
Step 2: Set Up a GA4 Tag in Google Tag Manager
- Access Google Tag Manager: Log in to GTM to start the configuration process.
- Create a New Tag: In your GTM dashboard, create a new tag. Choose “Tag Configuration” and then select “Google Analytics: GA4 Configuration.”
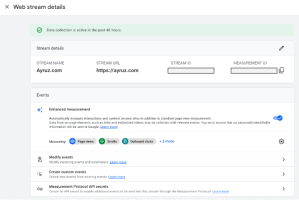
- Enter GA4 Measurement ID: Head back to your GA4 property and find your Measurement ID under Admin > Property > GA4 Settings. Copy and paste this ID into the corresponding field in GTM.
- Choose Trigger: Determine when the tag should fire. Typically, it’s set to fire on all pages, but customization is at your fingertips.
- Save and Publish: Save your tag setup and click “Submit” to publish the changes. This ensures that your GA4 configuration is live.
Step 3: Test and Verify
- Preview Mode: Activate GTM’s preview mode to ensure your GA4 tag is firing correctly. Navigate your site to verify data transmission to GA4.
- Real-time Reports: In GA4, visit the Realtime section to confirm that your data is being captured. This step ensures your setup is functioning seamlessly.
Conclusion
So, to circle back to our initial question, “Do you need Google Tag Manager with GA4?” Absolutely. The integration of GA4 with GTM is a powerhouse move, offering simplicity and efficiency in the analytics realm. Now armed with the knowledge of how to configure GA4 in GTM, you’re ready to navigate the digital landscape with precision and data-driven insights.
Stay ahead, stay optimized, and let GA4 and GTM be your dynamic duo in the digital analytics game!
Unveiling Real-Time Insights: A Deep Dive into Viewing Path URLs in GA4
In the dynamic realm of digital analytics, understanding user behavior in real-time is a powerful asset for marketers and website owners alike. Google Analytics 4 (GA4) stands as a robust platform, providing a wealth of information about user interactions. However, navigating the Realtime report in GA4 can sometimes present challenges, particularly when it comes to viewing the precise path URL. This article aims to demystify the process, offering a comprehensive guide to reveal the exact Page URL in the Realtime report.
The Real-Time Analytics Landscape
Real-time reporting in GA4 provides a dynamic snapshot of what’s happening on your website at any given moment. It encompasses active users, events, and conversions, giving you an immediate overview of your online landscape. However, one aspect that might have left users curious is the absence of the path URL in the default Realtime report view.
The Quest for Page URLs: Why It Matters
Understanding the significance of viewing path URLs in real-time is essential before delving into the how-to guide. This capability allows you to:
- Monitor Campaign Effectiveness: Instantly assess the impact of ongoing marketing campaigns or promotions.
- Detect Live Issues: Identify and address issues on specific pages as they occur, ensuring a smooth user experience.
- Track User Flow: Follow the user’s journey through your site in real-time, enabling quick adjustments to improve engagement.
How to View Path URLs in Real-Time: A Step-by-Step Guide
Step 1: Log into Your GA4 Account
Begin by logging into your Google Analytics 4 account. Ensure you select the property corresponding to the website you wish to monitor in real-time.
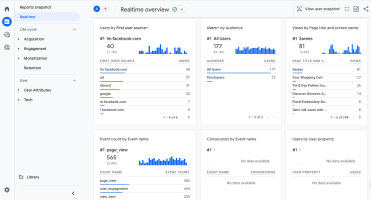
Step 2: Navigate to the Realtime Section
In the left-hand menu, find and click on “Reports.” From the dropdown, select “Realtime.” Here, you’ll find a snapshot of current activities on your site.
Step 3: Explore the “Events” Tab
Within the Realtime report, locate the “Events” tab. This section is pivotal in uncovering the elusive path URL.
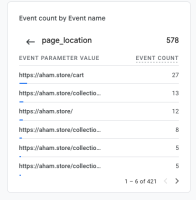
Step 4: Click on “Event Count by Event Name”
Delve deeper into the world of events by clicking on “Event count by Event name.” This action will reveal a list of events occurring on your site in real-time.
Step 5: Select “page_view” from the List of Events
In the list of events, find and select “page_view.” This specific event is the key to unlocking the information you seek.
Step 6: Discover “page_location” – Your Page URL
With a click on “page_view,” the veil lifts, revealing the sought-after “page_location.” This attribute precisely denotes your page URL.
The Marketer’s Game-Changer
This meticulous exploration isn’t merely a technical maneuver; it’s a game-changer for marketers. Gaining access to the real-time page URL empowers you with a deeper understanding of your audience’s instantaneous behavior. Whether you’re tracking the success of a new campaign or addressing issues promptly, this insight is your secret weapon in the digital arena.
The Technical Aspect: What Is “page_location”?
Understanding the technical side of the revelation is valuable. “page_location” in GA4 represents the exact URL of the page being viewed. It is a part of the data layer, providing comprehensive information about the user’s interaction.
In Conclusion
While navigating the real-time report in GA4 might initially pose a challenge, armed with this nifty trick, you are now equipped to unveil path URLs effortlessly. Embrace the power of real-time insights, decode your audience’s behavior, and elevate your digital strategy to new heights. The ability to view path URLs in real-time is not just a technical skill; it’s a strategic advantage that can significantly impact how you respond to the ever-changing landscape of online user interactions.
In a world where every click counts, mastering the real-time analytics game in GA4 is a journey worth taking. So, dive in, explore the nuances of user behavior, and let the insights guide you towards a more optimized and responsive digital presence.

How you acquire users? Differences Between User Acquisition and Traffic Acquisition in GA4
In the bustling world of digital analytics, understanding how users discover and interact with your online domain is pivotal. Two critical reports in Google Analytics 4 (GA4), User Acquisition and Traffic Acquisition, play distinct roles in this journey. In this exploration, we will delve into the nuances, highlight the differences, amplify the challenges, and offer a simple solution to decipher the mysteries of User Acquisition vs. Traffic Acquisition.
DIFFERENT ATTRIBUTION:
At the heart of the User Acquisition vs. Traffic Acquisition debate lies the difference in attribution models.
USER ACQUISITION: EMBRACING THE FIRST-CLICK ATTRIBUTION MODEL
User Acquisition, as the name suggests, focuses on how users are acquired. It employs the first-click attribution model. In simpler terms, it gives credit to a user’s first interaction with your website or app.
TRAFFIC ACQUISITION: NAVIGATING THE LABYRINTH OF LAST-CLICK ATTRIBUTION
On the other hand, Traffic Acquisition tracks the most recent source of traffic that brought a visitor to your website. This report relies on the last-click attribution model. It attributes the conversion or interaction to the last touchpoint before the user arrives at your digital doorstep.
USER ACQUISITION VS. TRAFFIC ACQUISITION:
Understanding the specifics of each acquisition type is essential for navigating the digital landscape effectively.
USER ACQUISITION: THE PRELUDE TO ENGAGEMENT
What it tells us:
- First Interaction: Reveals where users first discovered your website.
- First-Click Attribution: Credits the channels or sources that initiate user engagement.
Example: Imagine a user stumbles upon your site through an organic search result. Using the first-click attribution model, User Acquisition would credit this search as the initial touchpoint that led the user to your digital space.
TRAFFIC ACQUISITION: TRACING THE FINAL STEPS
What it tells us:
- Last Interaction: Focuses on the most recent touchpoint before the user arrives.
- Last-Click Attribution: Attributes the conversion or interaction to the last channel or source.
Example: Now, consider the user from the previous example. After discovering your site through organic search, they later click on a social media ad leading to a conversion. Traffic Acquisition, using the last-click attribution model, would credit the social media ad as the final step in the user’s journey.
THE ATTRIBUTION PUZZLE: NAVIGATING CHALLENGES IN UNDERSTANDING USER ENGAGEMENT MODELS
As straightforward as these reports sound, the disparity in attribution models often amplifies the challenges for marketers and website owners.
User Acquisition Dilemma: The problem lies in understanding that User Acquisition credits the first interaction, which might only sometimes align with the last touchpoint that led to a conversion. This can lead to misconceptions about the effectiveness of specific channels or sources.
Traffic Acquisition Challenge: Conversely, relying solely on Traffic Acquisition might overlook the initial touchpoints that play a crucial role in engaging users. The report might not provide a holistic view of the user journey by focusing on the last-click attribution model.
SOLVING THE PUZZLE: BRINGING CLARITY TO USER ENGAGEMENT WITH A HOLISTIC STRATEGY
The key to overcoming these challenges is adopting a holistic approach that blends User and Traffic Acquisition insights.
A HOLISTIC USER JOURNEY:
- Combine User and Traffic Acquisition Reports:
- Understand that both reports are crucial for a comprehensive view.
- Utilize User Acquisition to see how users initially find your platform.
- Complement this with Traffic Acquisition to understand the final steps before conversion
2. Embrace Attribution Flexibility:
- Recognize that attribution models serve different purposes.
- Blend insights from first-click and last-click attribution to form a complete understanding of user journeys.
REAL-WORLD EXAMPLE:
Consider a user who discovers your website through an email campaign (User Acquisition) and later converts after clicking on a paid search ad (Traffic Acquisition). By combining insights from both reports, you see the complete user journey, understanding the role of each touchpoint in the conversion process.
IN CONCLUSION, MASTERING THE DIGITAL SYMPHONY
As you navigate the GA4 terrain, remember that User Acquisition and Traffic Acquisition reports are not adversaries but symphony members playing different tunes. By harmonizing insights from both, you can orchestrate a complete understanding of user engagement. Unraveling the User Acquisition vs. Traffic Acquisition problem is about more than choosing one over the other but realizing their unique contributions to the digital symphony.
So, embrace the diversity of attribution models, leverage insights from both reports and master the digital landscape with a nuanced understanding of how users embark on their journey through your online realm.

Maximizing E-Commerce Success with GA4: Navigating the Checkout Journey
In the fast-paced world of e-commerce, the Checkout Journey Report in Google Analytics 4 (GA4) serves as a crucial compass for businesses seeking to optimize their checkout process. This predefined report unveils essential data and visualizations, shedding light on user interactions from initiation to purchase. Let’s embark on a journey through the key aspects of the Checkout Journey Report and explore how it can be a game-changer for e-commerce businesses.
Unlocking the Power of the Checkout Journey Report
Understanding the Checkout Funnel
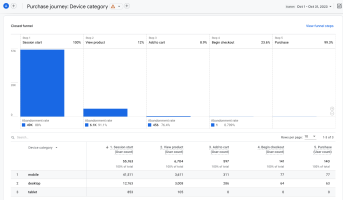
The Checkout Journey Report dives into the dynamics of the checkout process, encompassing four crucial steps: begin_checkout, add_shipping_info, add_payment_info, and purchase. This closed funnel approach exclusively includes users who initiate the journey at the first step, emphasizing the importance of the initial engagement.
Customization Insights
While the Checkout Journey Report offers a standardized view, customization options are limited. For those desiring a tailored funnel, a helpful guide on creating a custom funnel report in GA4 is available, allowing businesses to align analytics with their unique objectives.
Why Utilize the Checkout Journey Report?
Identifying Issues and Bottlenecks
It’s crucial for an e-commerce business to have a smooth checkout process as any issues or bottlenecks can have a negative impact on the business. The Checkout Journey Report acts as a timely detective, enabling businesses to spot drop-offs at specific steps. For instance, a notable abandonment at the add_shipping_info page signals a potential issue, prompting a closer inspection of shipping details, costs, and other elements.
Where to Find the Checkout Journey Report in GA4
Locating the Checkout Journey Report in GA4 is a straightforward process:
- Access your Google Analytics 4 property.
- Navigate to the “Reports” section in the left-hand menu.
- Look for the report under either the Monetization or Drive online sales topic in the respective collections.
- Click on the report to open it.
Customization of navigation is possible for adding the report to any collection, providing flexibility for easy access.
The Anatomy of the Checkout Journey Report
Event Implementation
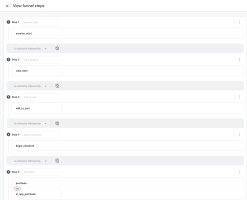
The Checkout Journey Report relies on the implementation of eCommerce Checkout Steps events. These events include:
- begin_checkout: Initiates the checkout process.
- add_shipping_info: Populates the Add shipping step.
- add_payment_info: Populates the Add payment step.
- purchase: Populates the Purchase step.
Ensure all these steps are enabled for accurate data representation. Note that third-party solutions may vary in tracking capabilities, necessitating manual setup for certain events.
Exploring Funnel Steps
To gain insights into the steps constituting the funnel, users can click “View funnel steps.” This read-only view provides a comprehensive look at the user journey, allowing businesses to understand the flow without the ability to alter steps or conditions.
Deeper Insights with Dimension Segmentation
The Checkout Journey Report comprises a funnel chart and a table that can be segmented by dimensions. While the default view showcases data by “Device Category,” businesses can customize their analysis by selecting dimensions such as Browser, City, Country, Language, or Region. This flexibility adds granularity to understanding user behavior.
Abandonment and Retention Metrics
The Checkout Journey Report doesn’t stop at visualizing the funnel; it delves into abandonment and retention metrics. The abandonment rate below each step signifies the percentage of users who drop off at that specific point, providing insights into potential bottlenecks. Conversely, the retention rate illustrates the percentage of users progressing to the next step, offering a holistic view of user engagement.
Harnessing the Checkout Journey for Success
As e-commerce businesses strive for success, the Checkout Journey Report in GA4 emerges as a pivotal tool. By recognizing its significance, understanding its intricacies, and leveraging customization options, businesses can proactively address challenges, optimize the checkout process, and ultimately enhance the user experience. The Checkout Journey Report isn’t just a report; it’s a strategic ally in the pursuit of e-commerce excellence.