

Sanil Subash Chandra Bose


Sanil is the Founder of Ayruz Data Marketing, a global digital solutions company helping businesses scale through remote talent, AI-driven strategies, and performance marketing. With over 15 years of experience across the US and UK markets, he’s advised Fortune 500 brands and startups alike on growth, data, and digital transformation. A member of the Forbes Agency Council, Sanil is known for blending strategy with execution to drive measurable business outcomes.
Sanil Subash Chandra Bose
Blogs
How to Build Custom Reports in GA4 and Understand the Differences Between Reports, Explorations, and Looker Studio
Google Analytics 4 (GA4) offers multiple ways to analyze user data through Custom Reports, Explorations, and Looker Studio. Each tool serves a different purpose and helps businesses track user behavior effectively.
One common use case is tracking the sign-up process on a website, where we need to measure:
- Total users who viewed the sign-up page
- Users who started the sign-up process
- Users who completed the sign-up
In this guide, we will walk through:
- How to create a Custom Report in GA4 for a Sign-Up Funnel
- How it differs from GA4 Explorations and Looker Studio
- Why and when to use each tool for reporting
What Are GA4 Custom Reports, Exploration Reports, and Looker Studio?
1. Custom Reports (Reports Section)
Custom Reports in GA4 are pre-built reports that allow users to track key metrics over time without the need for advanced customization.
- Found under the “Reports” section in GA4.
- Used for ongoing tracking (e.g., sign-up conversion trends).
- Can be saved and accessed by multiple users.
- Best for: Regular reporting of predefined metrics like page views, conversions, and user engagement.
Limitations:
- Less flexible than Explorations.
- No advanced segmentation or custom visualizations.
2. Exploration Reports (Explore Section)
Explorations allow deeper analysis with customized charts, funnels, and segment comparisons.
- Found under “Explore” in GA4.
- Used for ad-hoc analysis and detailed funnel tracking.
- Includes funnels, cohort analysis, and path exploration.
- Best for: Identifying drop-offs in user journeys and analyzing behavior patterns.
Limitations:
- Not shareable as a report (only available in GA4).
- Requires more configuration compared to Custom Reports.
3. Looker Studio (Formerly Google Data Studio)
Looker Studio is an external dashboarding tool that connects to GA4 and other data sources to create interactive and shareable reports.
- Used for combining multiple data sources (GA4, Google Ads, CRM, etc.).
- Allows custom charts, real-time filtering, and user-friendly dashboards.
- Best for: Creating client-facing reports and visual dashboards with real-time updates.
Limitations:
- Requires setup and external data connections.
- No built-in funnel reports (needs manual setup).
How to Build a GA4 Custom Report for Tracking Sign-Ups
Now, let’s create a Custom Report in GA4 that tracks a Sign-Up Funnel:
- Step 1: Track total users who visit the sign-up page (
/signup). - Step 2: Track users who start the sign-up process (
SignUpStart). - Step 3: Track users who complete the sign-up (
SignUpEnd).
Step 1: Open GA4 and Navigate to Reports
- Log in to Google Analytics 4.
- Click on “Reports” in the left-hand menu.
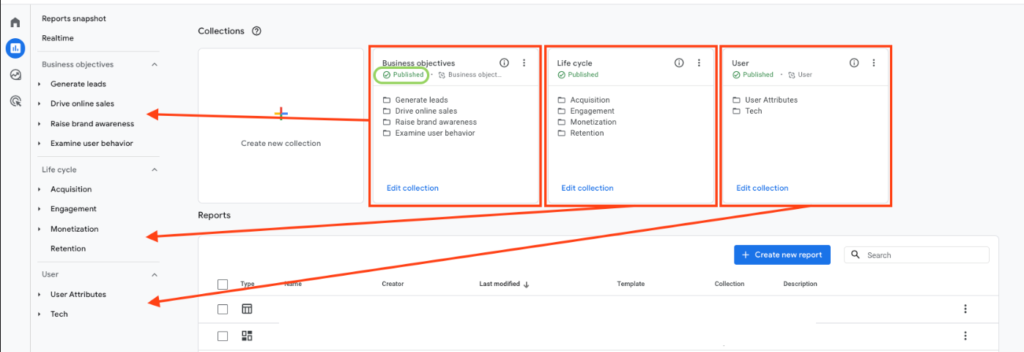
- Scroll down and click “Library” (only visible to Admins & Editors).
- Click “Create New Report” → “Create Detail Report”.
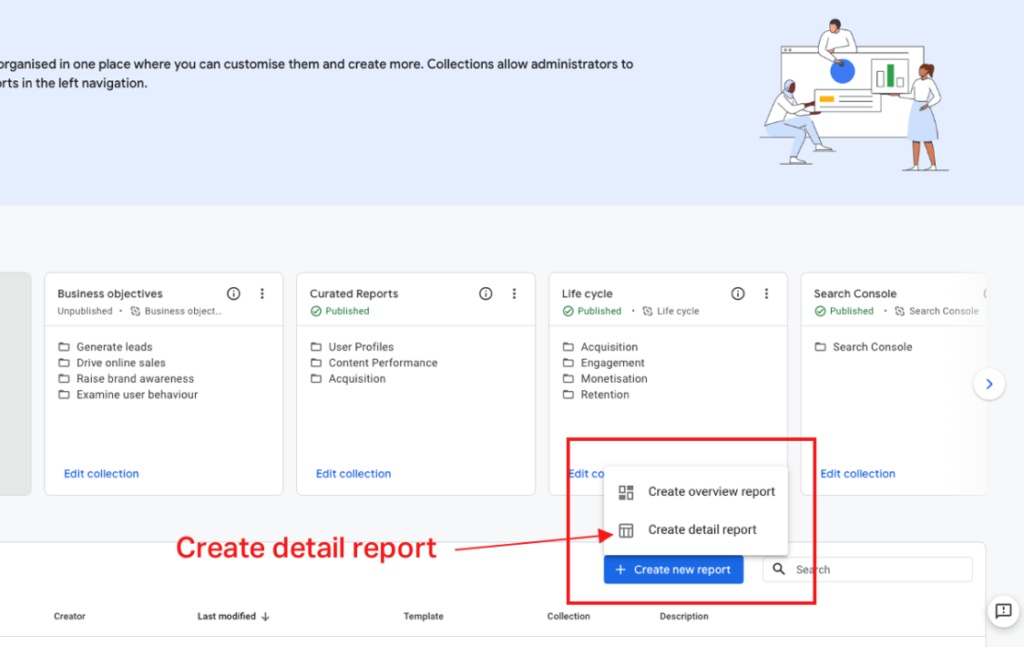
An image showing the navigation to the Reports Library.
Step 2: Set Up Report Dimensions & Metrics
- Name the Report →
"Sign-Up Funnel Analysis". - Click “Add Dimension” → Select:
- Page Path and Screen Class (to track the Sign-Up Page
/signup). - Event Name (to track
SignUpStartandSignUpEnd).
- Page Path and Screen Class (to track the Sign-Up Page
- Click “Add Metric” → Select:
- Active Users
- Event Count
- Conversion Rate
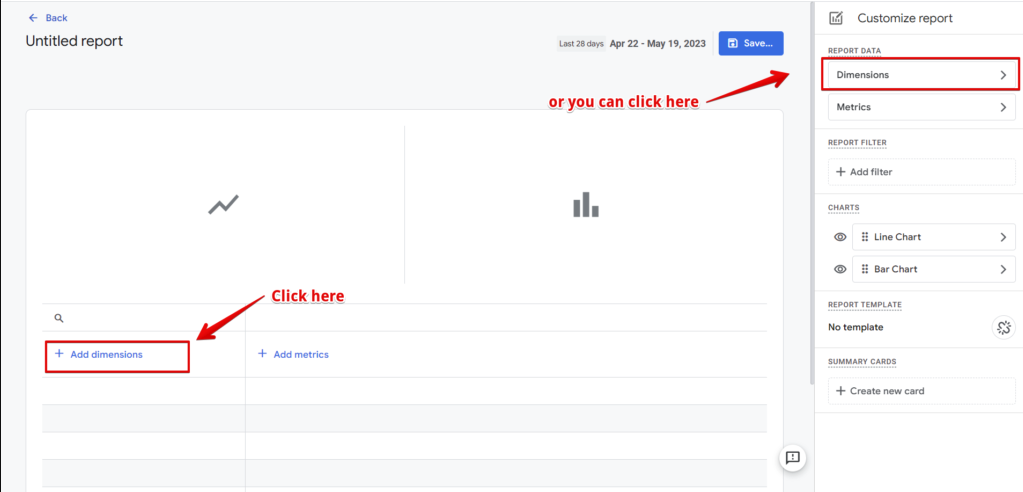
An image showing the dimension and metric selection.
Step 3: Add Filters to Track Sign-Up Stages
- Click “Add Filter” and set up the following:
- Filter 1: Track Sign-Up Page Views
- Event Name =
page_view - Page Path =
/signup
- Event Name =
- Filter 2: Track Sign-Up Starts
- Event Name =
SignUpStart
- Event Name =
- Filter 3: Track Completed Sign-Ups
- Event Name =
SignUpEnd
- Event Name =
- Filter 1: Track Sign-Up Page Views
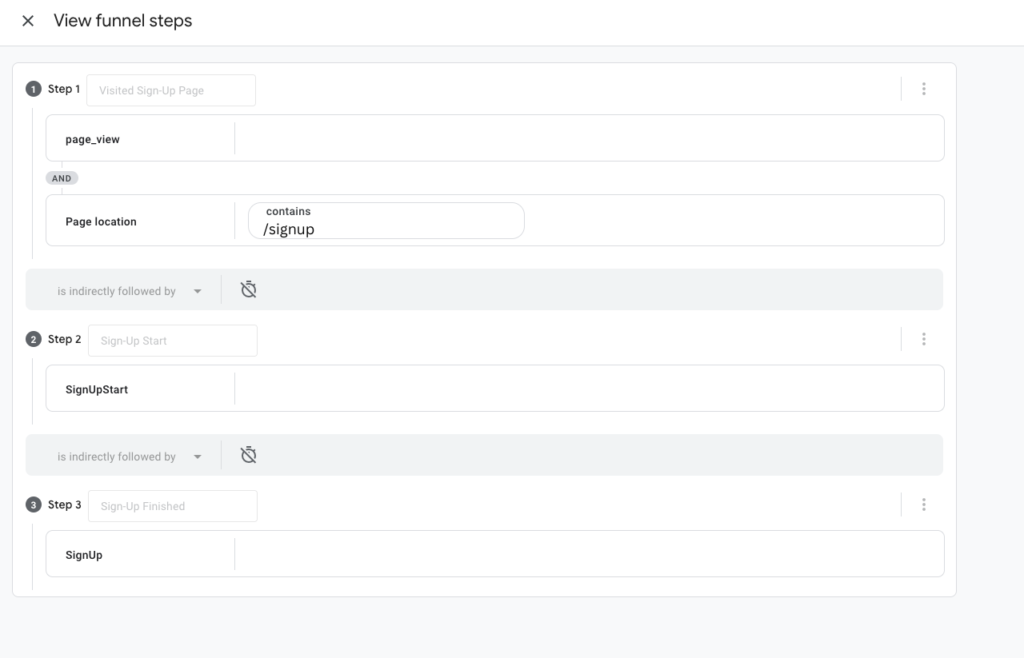
An image showing how to apply filters.
Step 4: Save and Publish the Report
- Click “Save”.
- Click “Save to Library” to make it accessible for all users.
- To add it to the Reports section:
- Go back to Library.
- Click “Edit Collection” and add Sign-Up Funnel Analysis to a relevant category.
- Click “Save & Publish”.
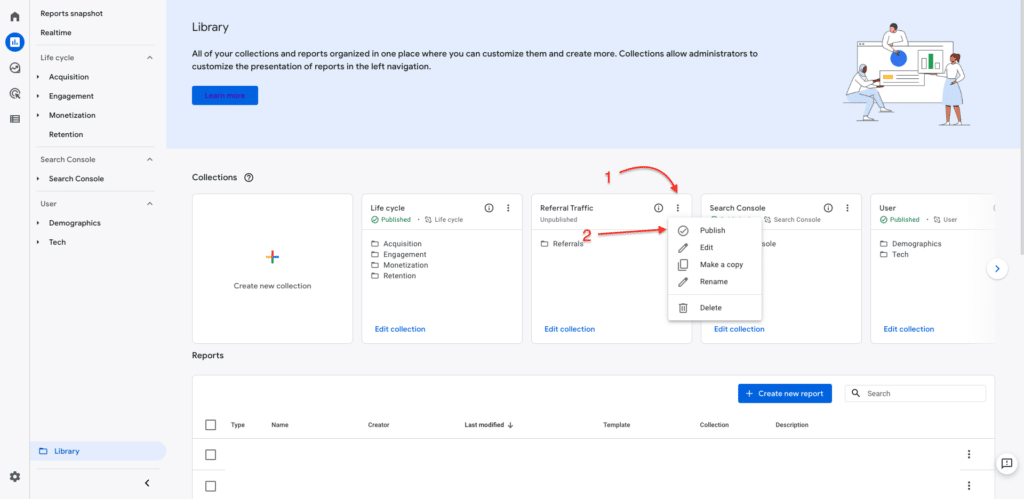
An image showing the final save & publish step.
How to Analyze the Custom Report
Once saved, open your Sign-Up Funnel Report to analyze:
- Total Visitors to the Sign-Up Page (
page_view). - Users Who Started the Sign-Up Process (
SignUpStart). - Users Who Completed the Sign-Up (
SignUp). - Conversion Rate = (SignUp / page_view) * 100.
If you see a high drop-off between page_view and SignUpStart, the issue could be:
- Confusing form fields.
- Slow page loading.
- Lack of trust signals (e.g., testimonials, security badges).
If you see drop-offs between SignUpStart and SignUpEnd, users may:
- Abandon due to too many steps.
- Face form validation errors.
- Be reluctant to share personal data.
| Feature | Custom Reports (Reports) | Explorations (Explore) | Looker Studio |
|---|---|---|---|
| Best For | Tracking ongoing trends | Deep analysis of user journeys | Visual dashboards for clients |
| Ease of Use | Easy (prebuilt templates) | Medium (custom setup needed) | Advanced (requires dashboard design) |
| Customization | Basic | High (funnels, cohorts) | High (visuals, filters, data blending) |
| Sharing & Exporting | Limited | Only within GA4 | Fully shareable |

What Is Retargeting And How It Actually Works
The concept of advertising has gone through a series of changes and challenges over the years. The way of bringing the products and services to the customers is maturing so uniquely with each brand. Every brand wants to stand out from the competition, and the way of marketing has played a vital role in positioning the brands in society. The brands that run their businesses online know the significance of online advertising. It reaches the mass audience simultaneously, and with the right digital marketing tools, one can capture the interest of their targeted audience.
However, recent studies show that about 96% of your first-time website visitors leave without buying anything. They might either be coming to your website without any intention of buying or leave before they complete a purchase.
The question here is how to bring them back to your website?
That’s how the Retargeting method comes into play.
What is Retargeting?
Retargeting is a form of paid advertisement that involves putting your ads in front of people who have visited your website recently and left for some reason. Marketers today consider retargeting as a vital tool for getting more sales and loyal customers, as it helps companies to reach a certain quantity of customers who don’t convert right away.
The basic rule of marketing is to help customers to make up their minds about purchasing a product of a brand. Retargeting builds visibility for your brand, allowing you to reach an audience that has already expressed interest in your products. It is also cost-effective when compared to the rest of the digital marketing tools.

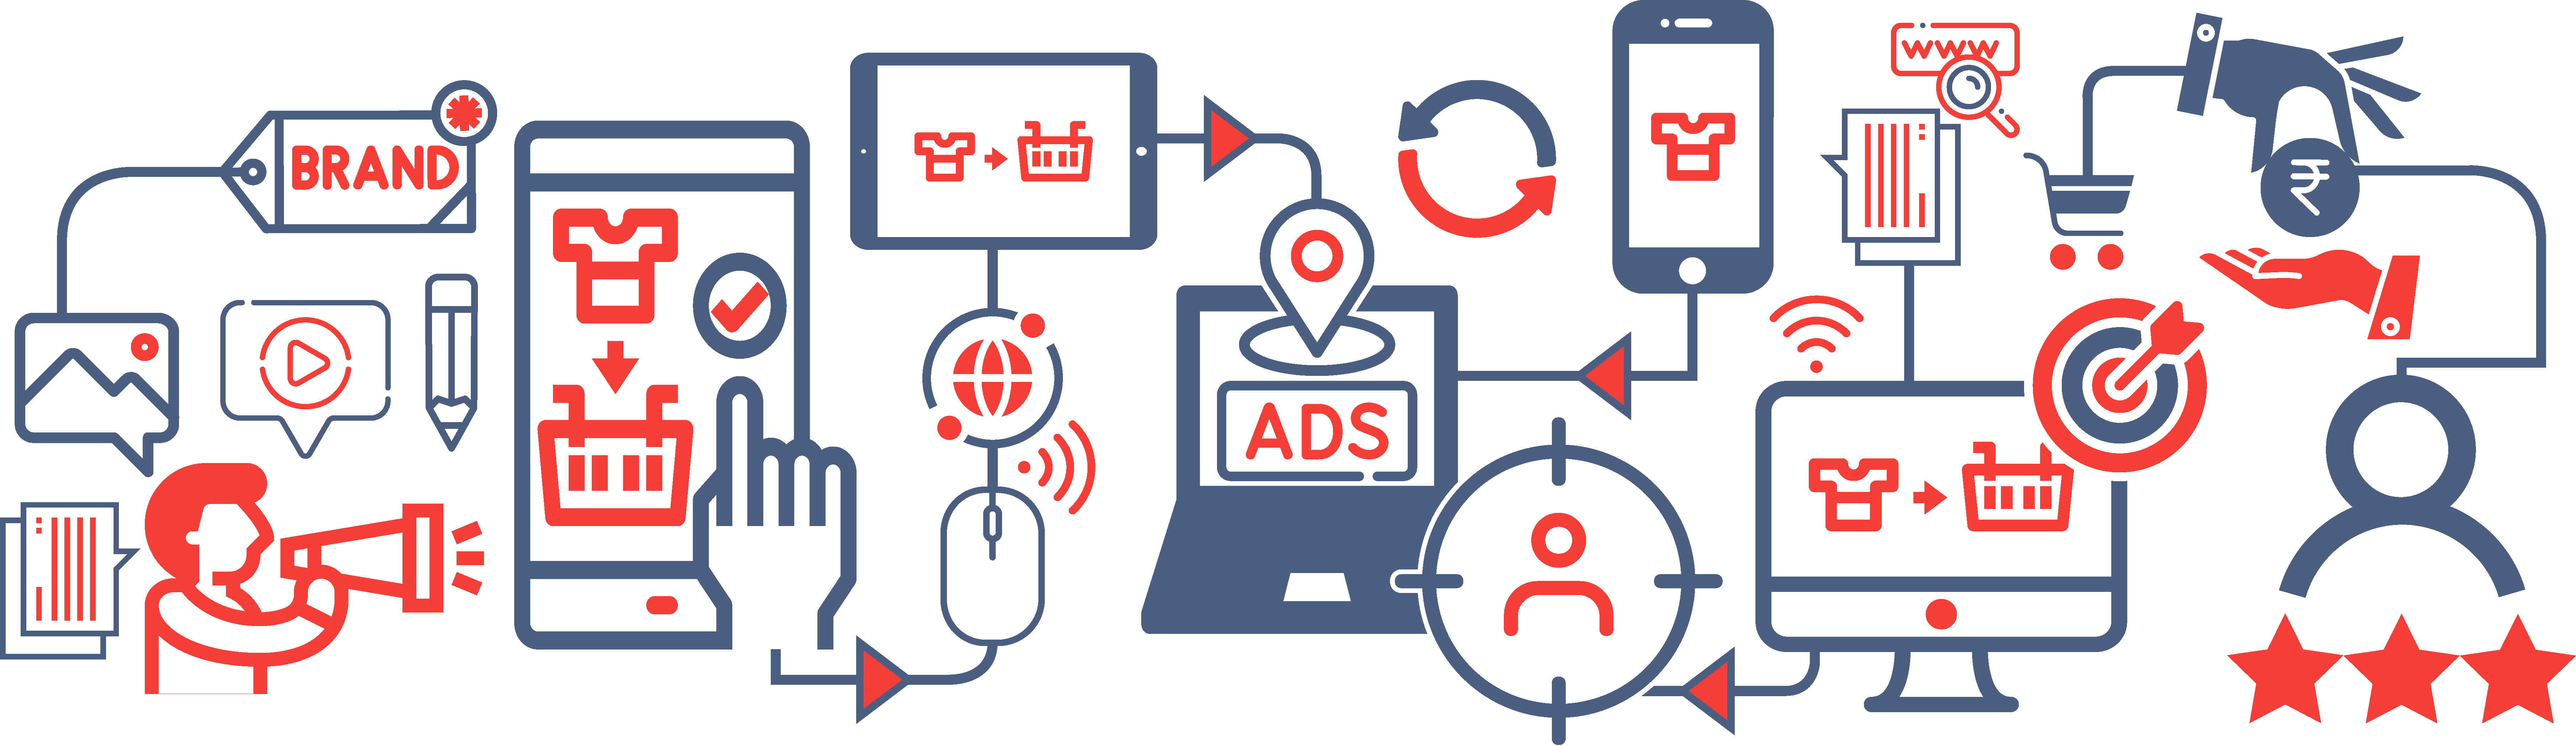
How Retargeting works?
Retargeting is a cookie-based technology that uses a simple Javascript code that is in-built on a website. The code will be invisible to the visitor of your page, and will not harm your page’s performance in any way. Every time a new visitor comes in, the code will drop an anonymous browser cookie, which will let your retargeting provider know when and where to share the ads. Retargeting advertisements remind your visitor about your products and services, no matter where they are. Hence the chances of the visitor revisiting your website and rethinking the purchase are high. This method is precise and accurate when it comes to targeting our audience. The visitors to retarget can be chosen using features that include targeting those people who visited a particular website or a partner website in the last 30 or 90 days. Various studies show that about 89% of the users either have a positive reaction or a neutral reaction to retargeting.
Why choose Ayruz to implement Retargeting?
As the digital era grows swiftly, numerous online sellers and brands are getting launched every day. While the competition increases day by day, the main goal of every brand should be to drive more traffic to their website. However, that’s not the only case. Even if your brand creates a perfectly designed advertisement, the advertisement must reach the target audience rather than a mass at random. It is to ensure that your brand achieves more sales and gets more loyal customers. Retargeting helps your brand to position itself in the user’s memory so that they will either purchase a product from you or will remember your brand when the need arrives.
We, Ayruz, will help you in ensuring that your website reaches the right audiences using unique algorithms and programs, at the right time and right platform. Our expert staff will guide you through the services appropriate for your brand marketing strategy and will provide you the performance report from time to time.
Types of Retargeting services offered in Ayruz
There are 6 types of Retargeting services that Ayruz provides, to ensure precise and proper engagement for your brand from potential customers.
Search Retargeting
It is the method of grouping a set of audiences based on their keyword search behavior and then uses that audience for digital advertising. It might not guarantee a definite customer, yet it helps to get the business to the people who require it.
Engagement Retargeting
This type of retargeting method is useful for those sites that offer channels of engagements like videos, games, etc. The purpose of a user’s actions and their level of involvement can be deduced based on the user’s activities toward these activities, to serve highly targeted display ads.
Contextual Retargeting
This practice allows two different sites to target each other’s audience based on their similar keyword searches and queries.
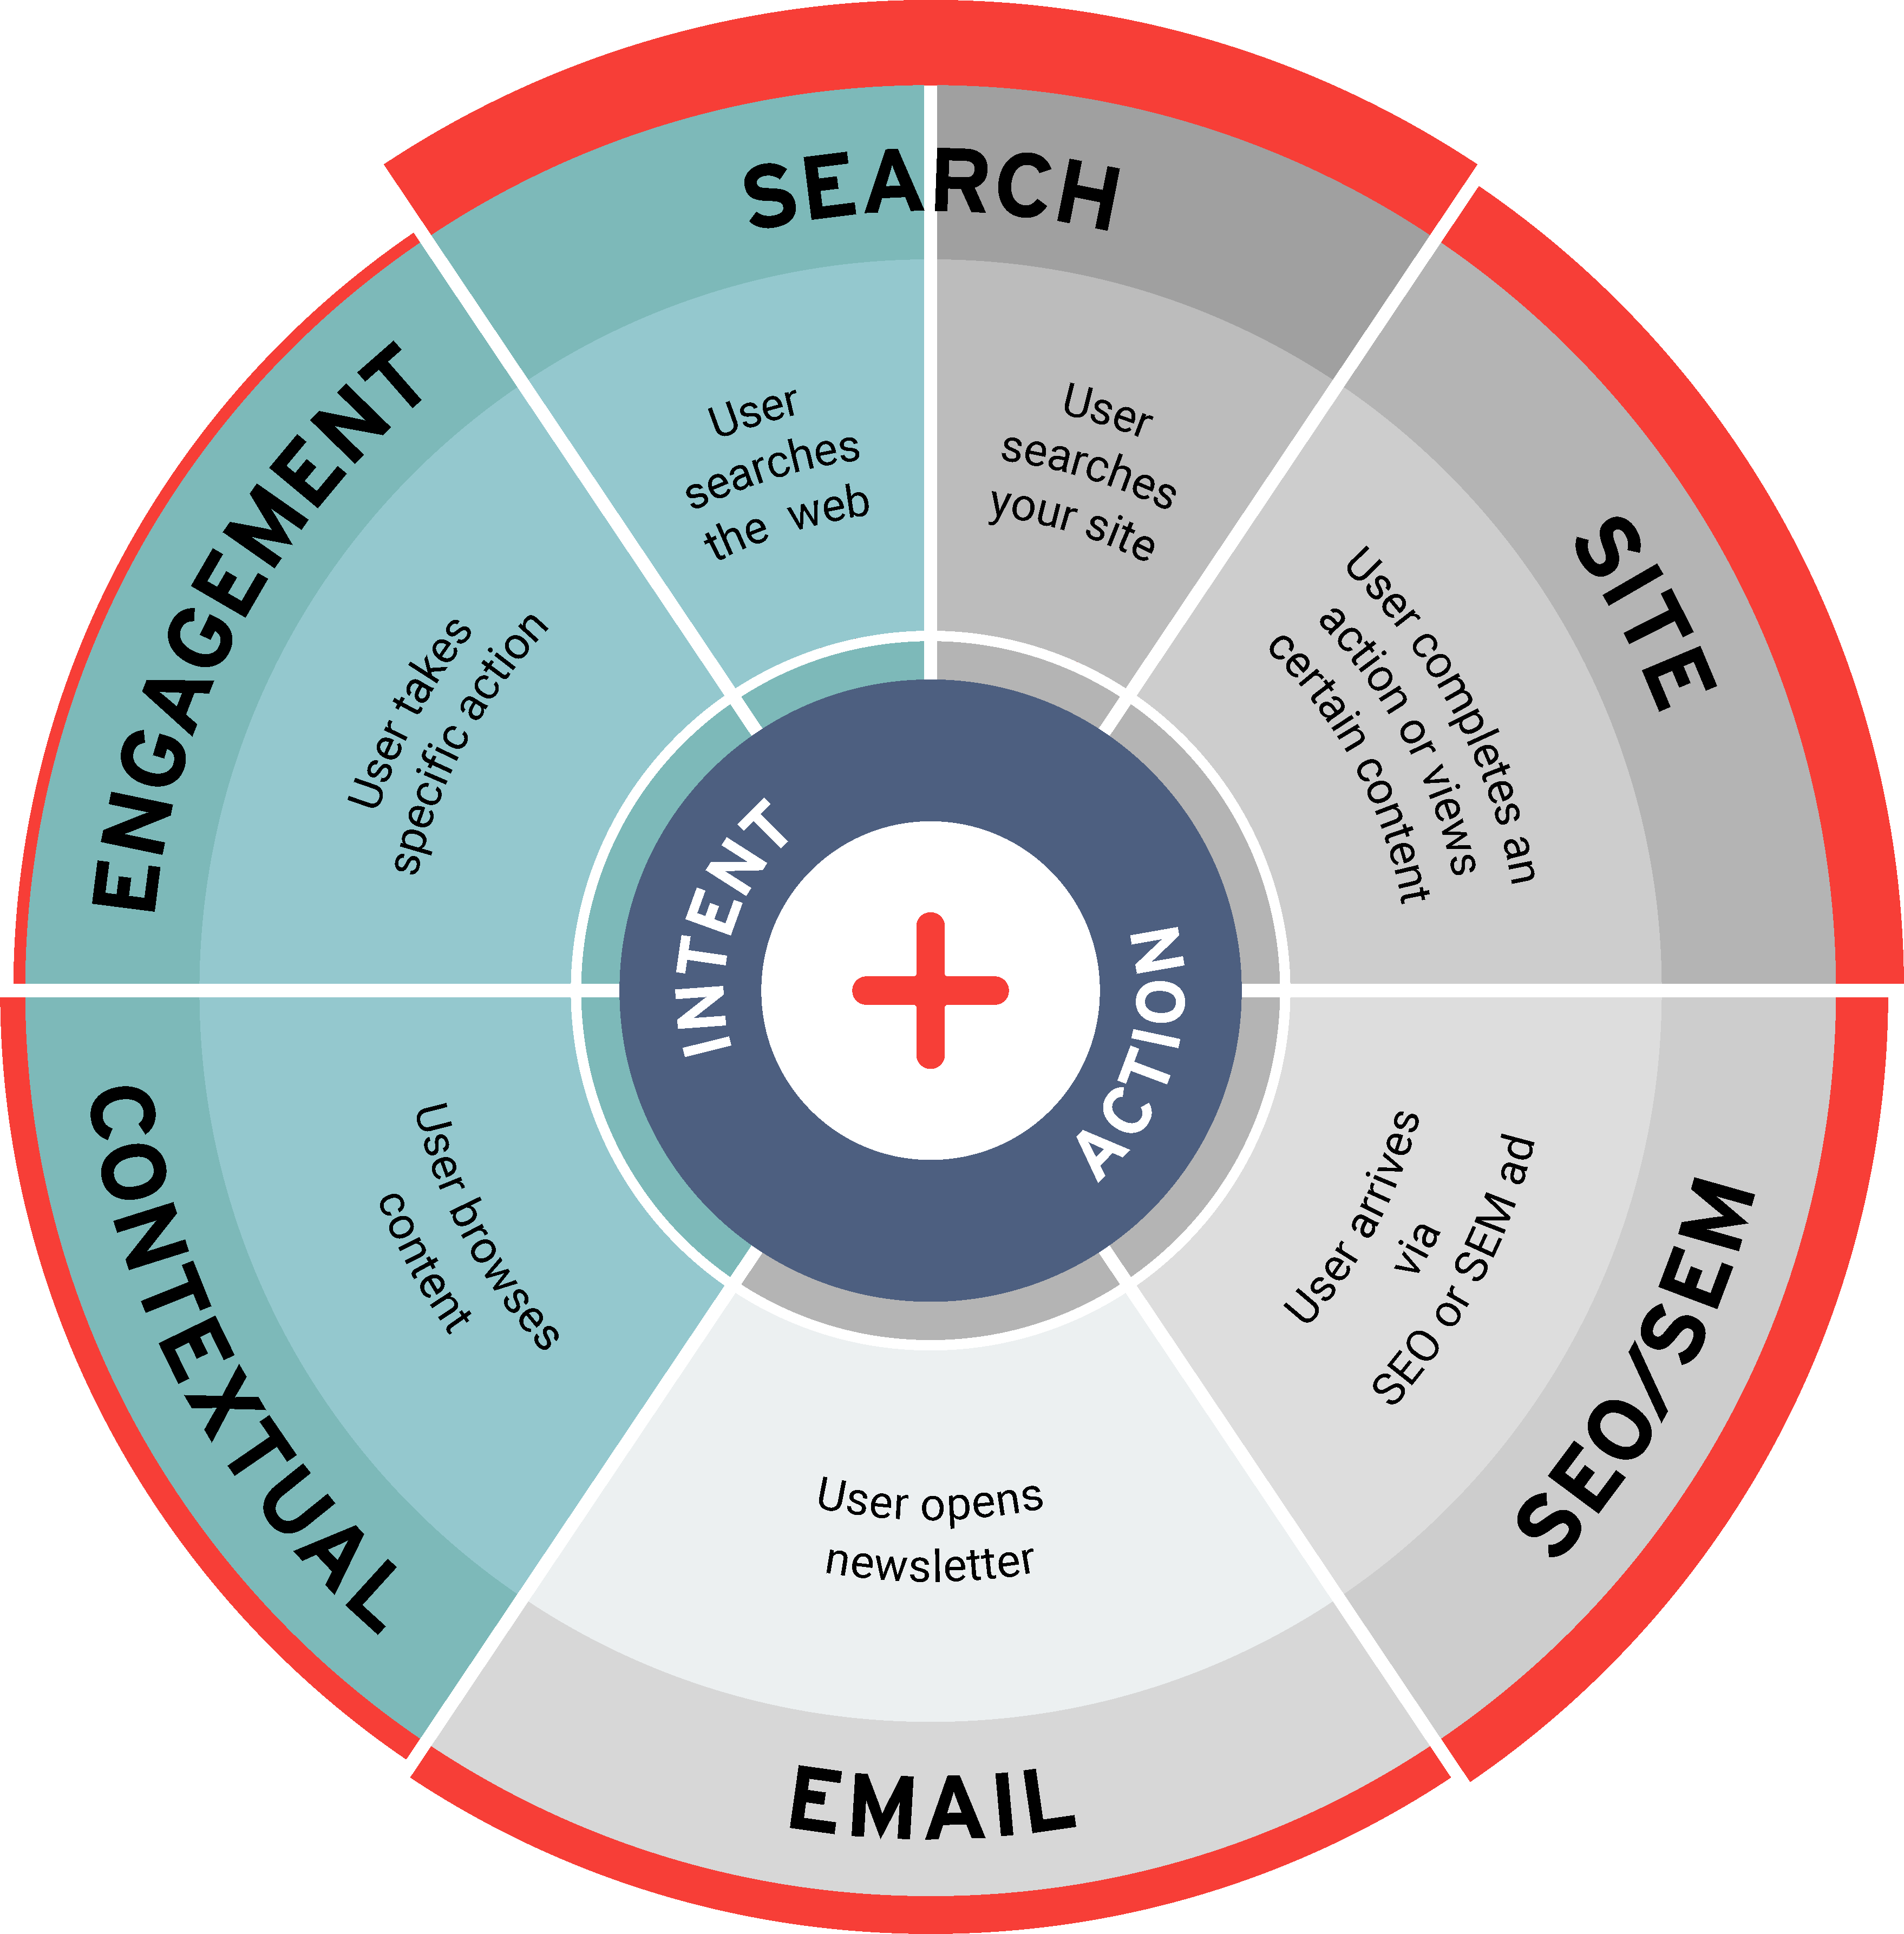
Site Retargeting
It is an advertising technique used by marketers to display their brand’s advertisement or reach out to those who have previously visited your site.
SEO/SEM Retargeting
When combining the search words used by the user that led them to your website and their actions after coming to your website, you get a deep insight into the user’s needs.
Email Retargeting
It is the practice of reaching out to those leads based on their actions taken on the emails of your business and service at a previous point.
Key Benefits of Retargeting
Retargeting is an innovative and cost-effective method that increases brand awareness in the most precise arrangement. Increased conversions ensure effective ROI. Hence retargeting has become essential for digital marketers over the years.
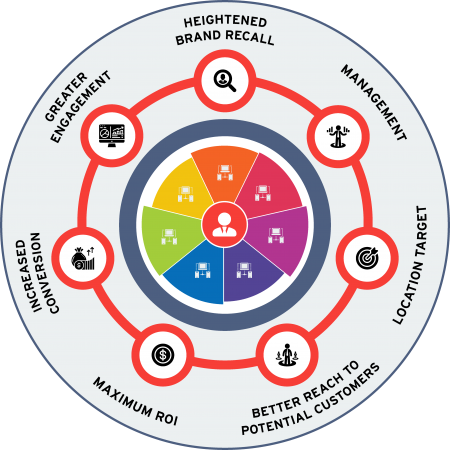
- Long term campaigns: The retargeted ads are repeatedly displayed to visitors after they leave your website, thus increasing the overall ROI. As the users see your brand’s advertisements, again and again, not only the chances of getting a purchase increases but also the brand becomes memorable to the users.
- Cost-effective: The amount spent on retargeting ads is generally less than the other digital marketing tactics, as it focuses only on your previous visitors and not the overall public.
- Tighten social engagements: Advertisements never run out of its course. So does retargeting ads. Retargeting ads can be shown on other websites and even on social media.

Sania Mirza Vs Hugh Jackman – Who give more ROI to an Indian brand?
We are always searching for something, if you know what someone is searching for then you understand him better. If you can know what a nation is searching for then you can make a killing out of it. I help companies make that killing and I make living out of it. Its called search trend analysis and is a combination of statistics, search marketing, and common sense.
This journey has helped me understand the world around me better. recently I was going through online search data related to mobile phone brands for a client of mine. I was specifically looking at the Indian Chinese brands, the ones like Karbon, Micromax, and Celkon. Have you heard about Celkon?
Celkon used Sania Mirza to launch a model called ‘Millennium Vogue Q455′ in July 2014. Having played a little bit of tennis myself, I am a big fan of hers.

Photo credits (Hindu.com)
I wanted to know how getting her involved helped the brand and this is what I found out.
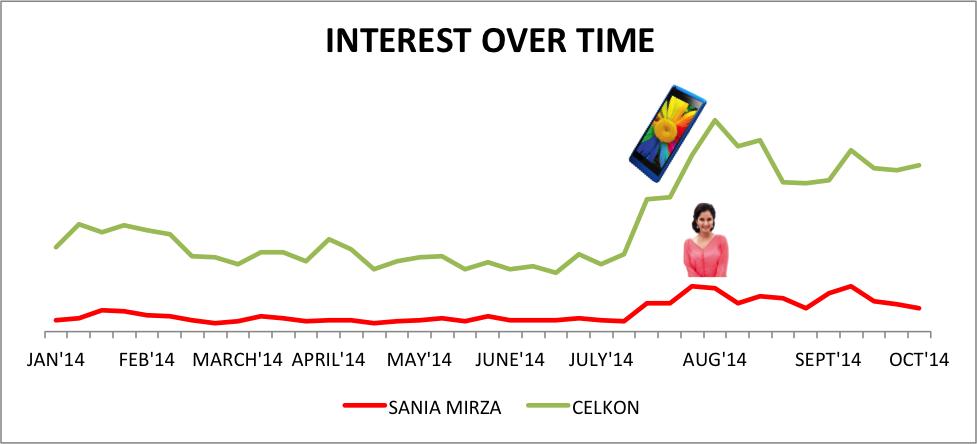
The search for Celkon started growing around the time of the launch and after a while, it’s becoming stable. So Sania Mirza launch worked for Celkon.
But the more interesting insight is the other graph, the search for Sania Mirza also started growing, but its growth declined after a while unlike the search for Celkon. To understand the reason I looked at the keywords that people were inputting.
Many of them were like “phone Sania Mirza launched”.
This means that the brand Celkon is not popular enough to have a standing of its own. People knew that Sania Mirza launched a phone, but they can’t remember which company it was and they were trying to find out.
Now, this just made me recall one of the Hugh Jackman ads from Micromax, I heard that they spend a fortune on him, so they must have got a huge spike in the search. So I collected the data and plotted the graph.
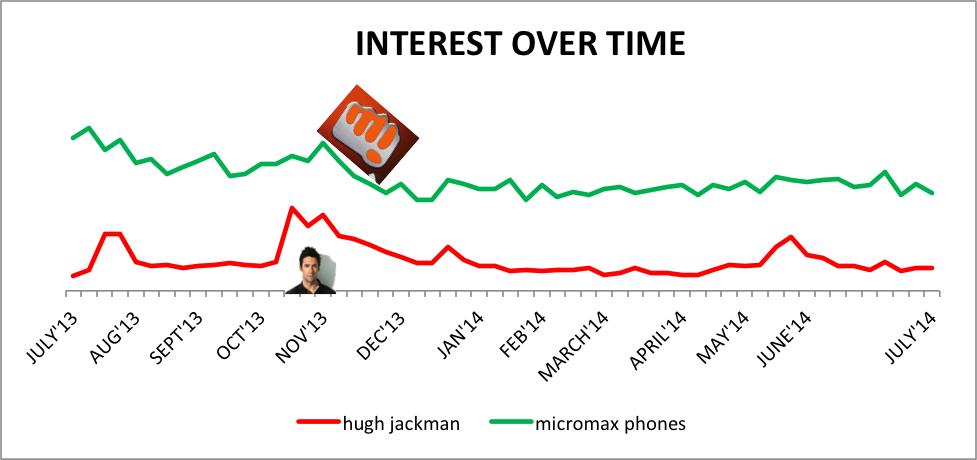
To my surprise, Hugh Jackman did not result in any considerable increase in search volume for Micromax. I thought a lot about it and finally concluded that Hugh Jackman is less popular in India than Sania Mirza. Here local celebrities work better than international celebrities. Looks like Micromax wasted money on Hugh Jackman.
Promotion:- If you want any such analysis done for your company let me know, I head a team of data scientists and programmers and help companies make sense of the data jungle out there. Please feel free to drop me an email at sanil@ayruz.com.
Consumer Loyalty To Brands After Data Breaches
New study sheds light on shoppers’ reaction to data breaches
Recent revelations about a potentially sweeping credit and a debit card data breach at The Home Depot raise new questions about the extent to which these events turn consumers away from impacted stores. In fact, Target saw its first-quarter sales drop 16% over last year following the well-publicized Target data breach in November 2013.
A new analysis based on actual credit card spending patterns by Lightspeed Financial Services Group (FSG) shows that close to one-quarter of credit card accounts used to make purchases at Target before the data breach had fewer purchases – and in some cases, no purchases – after the breach was announced. This analysis is based on Lightspeed FSG’s nationwide credit card behavioral tracking panel, which monitors consumer card use and spends on a continuous basis.
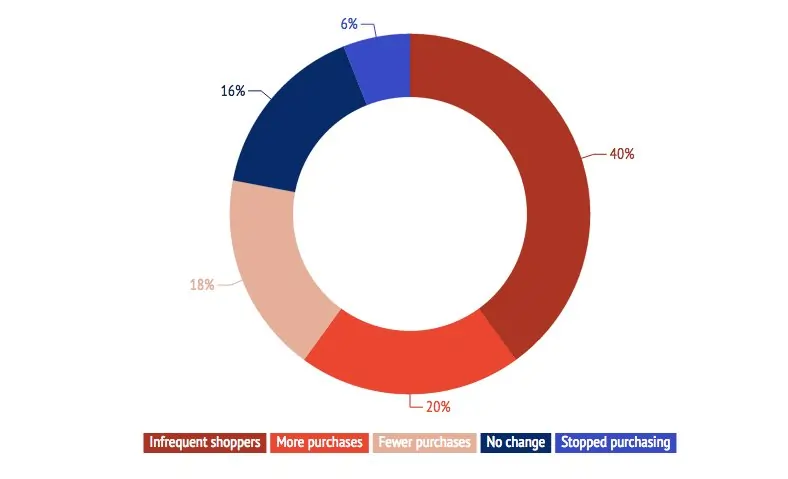
Lightspeed FSG’s analysis compared to credit card purchases at Target in the four months preceding the data breach announcement (September to December 2013) to the four months following (January to April 2014), finding that:
- About 6% of credit card accounts used at Target in late 2013 had more than two purchases in the four months preceding the Target data breach, but absolutely none in the subsequent four months.
- Another 18% of accounts used at Target in late 2013 were still used at Target after the data breach, but only about half as often.
- Yet, there were some credit card accounts that showed no decline in Target spending – about 37% of accounts were used at the same rate or more often than before the data breach.
The 18% of accounts with a sharp decline in Target purchases had an average of 7.8 purchases in the four-month period before the breach, but only 4.4 purchases in the four-month period following the incident.
Adapted from Lightspeed GMI

15 Captivating Stats From Around The Digital World
Well, I guess stats why they call it the blues.
And you can beat those January blues with our first stats round-up of the new year. Filled to the brim with the very best data analysis on digital marketing and e-commerce this week.
Then maybe afterward we can find out exactly where the brim of the internet really is.
Amazon’s Christmas
Amazon shipped 5bn items in 2014, with 40% from third-party sellers. According to the company, third-party sellers sold more than 2bn items in 2014.
Those 2bn items came from more than 2m sellers, which accounts for over 40% of the total units sold on Amazon.
Christmas mobile stats
Affiliate Window has revealed the following stats for mobile retail in December.
- Boxing Day saw an excess of 50% of traffic through a mobile device for the first time ever.
- 47,100 sales each day originated from a mobile device (smartphone and tablet).
- 19,900 of these were through a smartphone.
- 664 clicks originated from a mobile device every minute.
- 822 sales were generated through a smartphone each hour.
- 32.75% of revenue generated for its advertisers in December was through a mobile device.
A fifth of holiday shoppers wait until the last minute
Nearly 20% of all holiday shoppers wait until the last minute to buy their gifts according to Retale.
58% of all last-minute shoppers use smartphones and tablets to help them shop and among this group, 88% use their mobile devices to locate stores and check store hours as they get closer to Christmas Day.
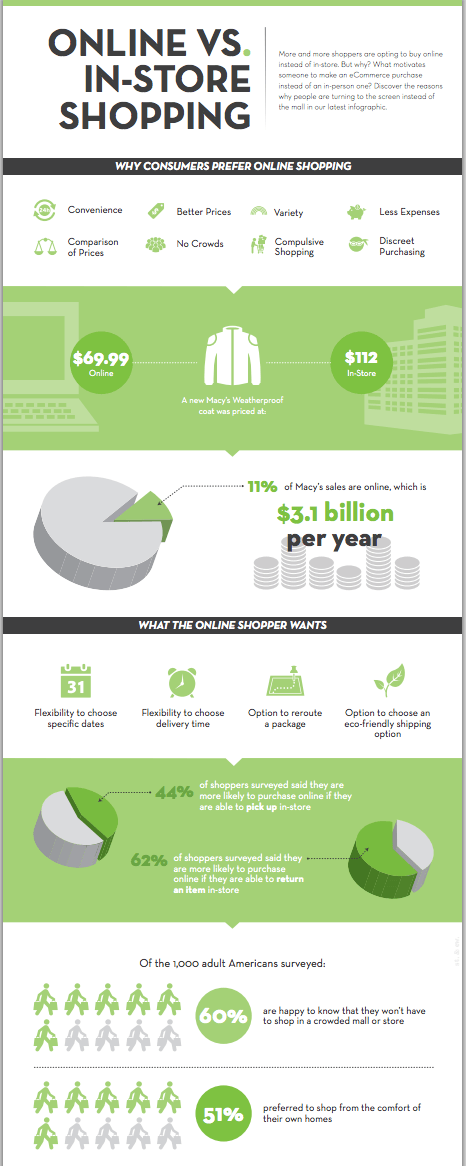
Online vs. in-store shopping
Nextopia has shared the following infographic on why consumers prefer online shopping, including such stats as 44% of shoppers surveyed said they are more likely to purchase online if they are able to pick up in-store, and that 62% are more likely to shop online if they can return an item in-store.
Christmas shopping woes
According to JDA/YouGov research, nearly one in three British online Christmas shoppers experienced problems with orders. Here are some more stats from the survey:
- 49% had suffered from missed deliveries, while 45% had experienced late deliveries or never received their goods.
- 47% of Brits did at least half of their shopping online; of those who did Christmas shopping, 18% stated that they did more Christmas shopping online than they originally planned.
- 29% ended up ordering items earlier than planned as a result of retailers setting ordering deadlines a week or more in advance of Christmas Day.
- 17% of shoppers stated that ordering deadlines had made them shop at a store instead of online.
Christmas click and collect
From the same YouGov research, here are some stats for click and collect usage in December:
- 39% of online shoppers opted to use click and collect services this Christmas.
- One-quarter of shoppers stated they chose to shop specifically with a retailer that offered click and collect over one that solely offered home delivery.
- 19% of online shoppers used an alternative retailer this Christmas as result of their preferred one not having items available online or having delivery times that met their requirements.
Although 40% of clicks and collect shoppers had a very positive experience of using the service, 35% of users encountered negative issues:
- 30% experienced long waiting times due to a lack of in-store staff.
- 29% cited a lack of a dedicated area in-store for click and collect purchases.
- 25% said, staff were unable to look or took a long time to source goods in-store.
There’s more on click and collect here: What have we learned about click and collect this Christmas?
One-quarter of shoppers will return goods
Retale has polled holiday shoppers and discovered that nearly one in four will return or exchange at least one of the presents they received this holiday season. Here are some additional stats:
- 70% prefer to return or exchange gifts in-store versus online.
- 62% said the in-store return and exchange process was convenient.
- Nearly 40% called the online return and exchange process inconvenient.
- 85% want retailers to allow in-store returns or exchanges of gifts bought online.
Non-marketing stat of the week
There were more than 22,000 manmade objects orbiting the Earth in 2013.

Then in October that year, the upper stage of a Russian rocket disintegrated in low Earth orbit and now there are 500 more.
Retailers could do more for mobile shoppers
Somo has analyzed the mobile capabilities of the top 50 high street retailers, finding that:
- 40% do not have a mobile optimized store locator.
- 20% don’t have a transactional mobile site.
- 30% don’t have an iOS app.
- 28% don’t have an Android app.
- 44% do not have a tablet optimized site.
- 46% don’t support responsive web design.
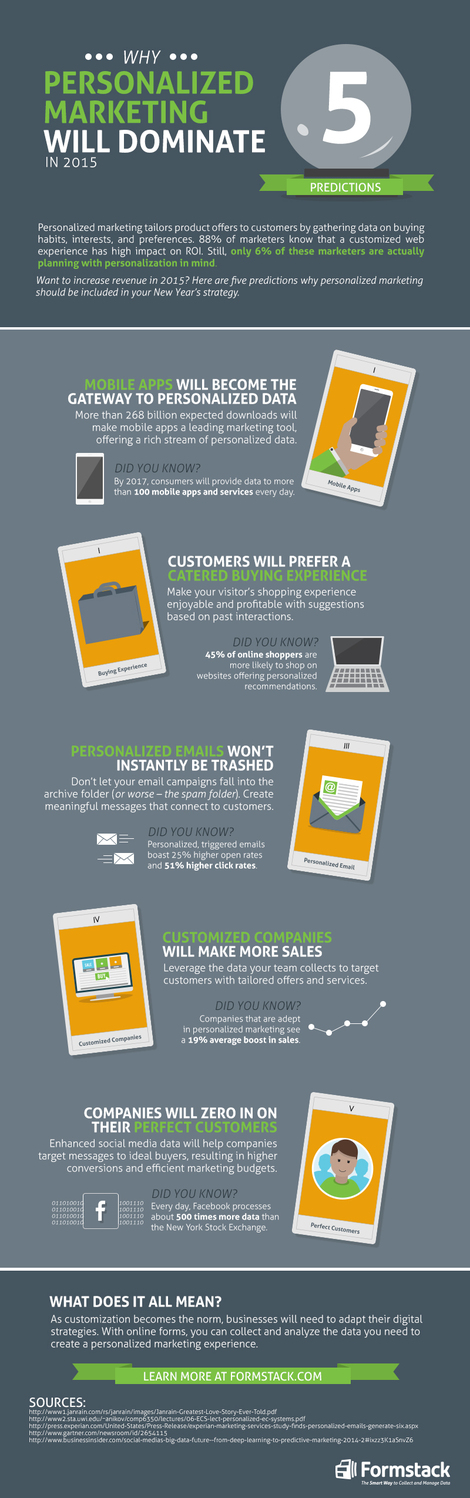
Personalized marketing set to dominate 2015
Here’s an infographic from Formstack, claiming that 45% of online shoppers are more likely to shop on websites offering personalized recommendations, while personalized triggered emails boast 25% higher open rates and 51% higher click-through rates.
YouTube’s most watched ads of 2014
According to Google itself, the top 10 ads earned a combined 330m views globally and contrary to expectation, Sainsbury’s Christmas ad topped the charts, racking up more UK views than the John Lewis Christmas advert.
Here’s the chart.
- Sainsbury’s Christmas 2014 Ad
- John Lewis Christmas Advert 2014 #MontyThePenguin
- Nike Football: Winner Stays
- Nike Football: The Last Game
- Always #LikeAGirl
- Three #SingItKitty
- Marks & Spencer #FollowTheFairies
- Save the Children – Most Shocking Second a Day
- Guinness – Sapeurs
- Pepsi Max – Human Loop the Loop
Four big reveals from CMOs
Conductor has asked 182 marketing executives about where they think the digital media industry is heading in 2015:
- 61% of marketing executives say data is “more” or “much more” important than it was 12 months ago.
- 65% of marketing executives plan on spending more on marketing technology in the coming year, with a large percentage (28%) planning to spend significantly more (25% or more).
- On a 4-level scale from “not important” to “very important,” customer research was “very important” to content creation across all organization types (B2B, B2C, Agency).
- Agencies were most in agreement about the need for pre-content research; 85% of agency executives deemed it “very important” while 76% of B2B executives also described it as “very important.”
- 90% of those surveyed agree that inter-department support is “important” or “very important” to their brands’ digital marketing success.
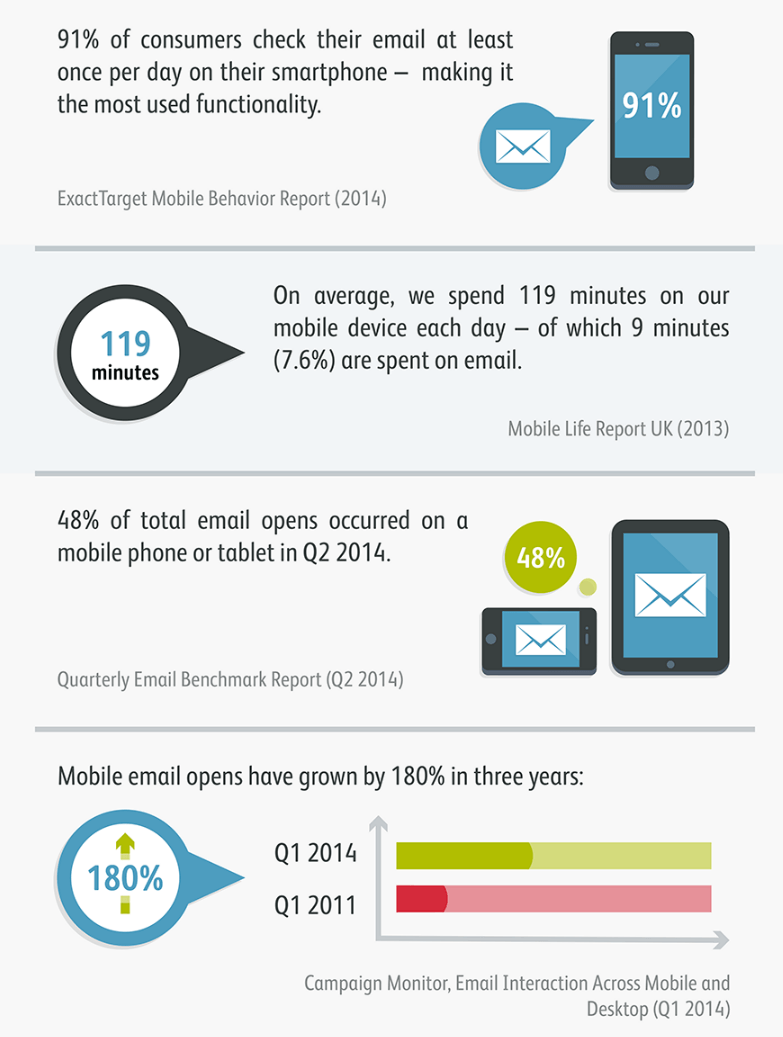
Responsive email design is no longer optional
Instiller and Wyzowl have created this infographic full of stats to show how responsive email design *is* email design.
Get away
A recent report by Hotels.com stated that traffic to UK booking websites peaked at 8 pm on 28 December.
According to the Telegraph, Thomson and First Choice reported record traffic over Christmas and Boxing Day, with nearly 940,000 people researching holidays on the internet. A 30% rise on last year.
The most popular time for holiday searches on Boxing Day was apparently between 9 pm and 10 pm during the Birds of a Feather Christmas special.
Make of that what you will. As a side note, here are 10 essential features all travel websites must have to capitalise on this.
Non-marketing infographic of the week
Let’s check to see how many fanciful sci-fi predictions from the 50s and 60s have now come true as we enter the year 2015, a time when Marty McFy would eventually misplace his sports almanac.
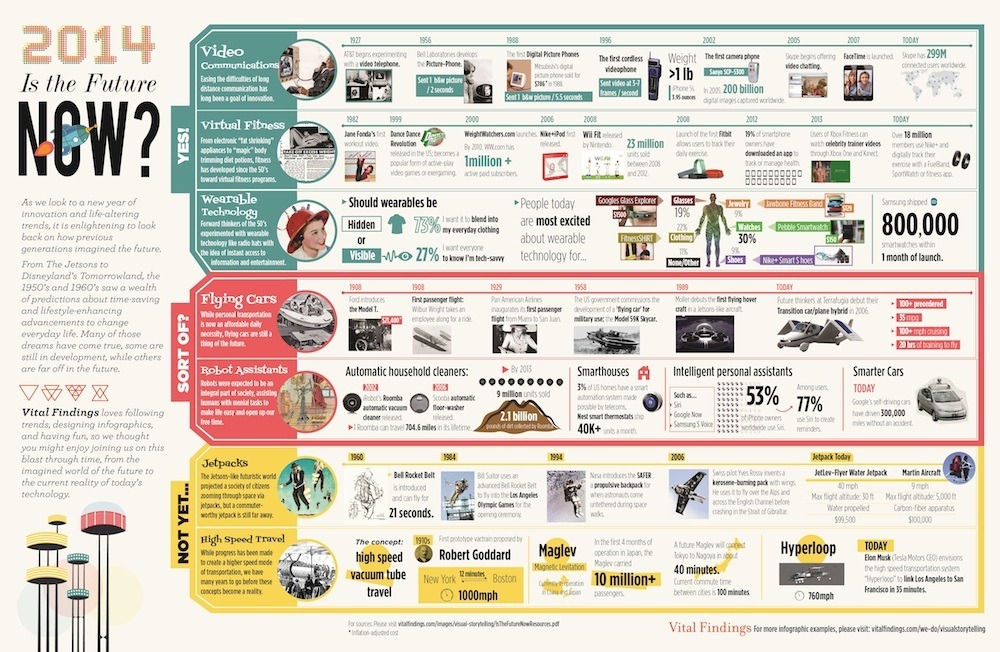
Adopted from Econsultancy

How to Get Cheaper Flight Tickets Online – A Digital Marketing Insight
Being a marketer for the past eight years, I try to learn new things and apply new strategies for my clients. I never thought I would exploit a marketing tactic intelligently to get more rewards while booking an air ticket online for my wife who is coming to India to attend my brother’s wedding in July 2016.
This article is about how I saved considerably for an air ticket booking, exploiting a simple tactic used by the marketing team and a critical reflection of it.
As mid of June is a busy season, getting a cheaper air ticket would be a daunting task. I tried air tickets from Yatra.com, Skyscanner, Expedia and few travel agents as well. Interestingly, the price given by the travel agent was INR 10,000 less than the price I have got from Yatra, Expedia and other travel websites.
I tried to book the ticket from the Yatra and abandoned the transaction during the booking stage. So, the Yatra customer care gave me an offer for INR 1,000 less than what the travel agent quoted me. So effectively, INR 11,000 have been saved from this negotiation. This didn’t stop me from doing further research online.
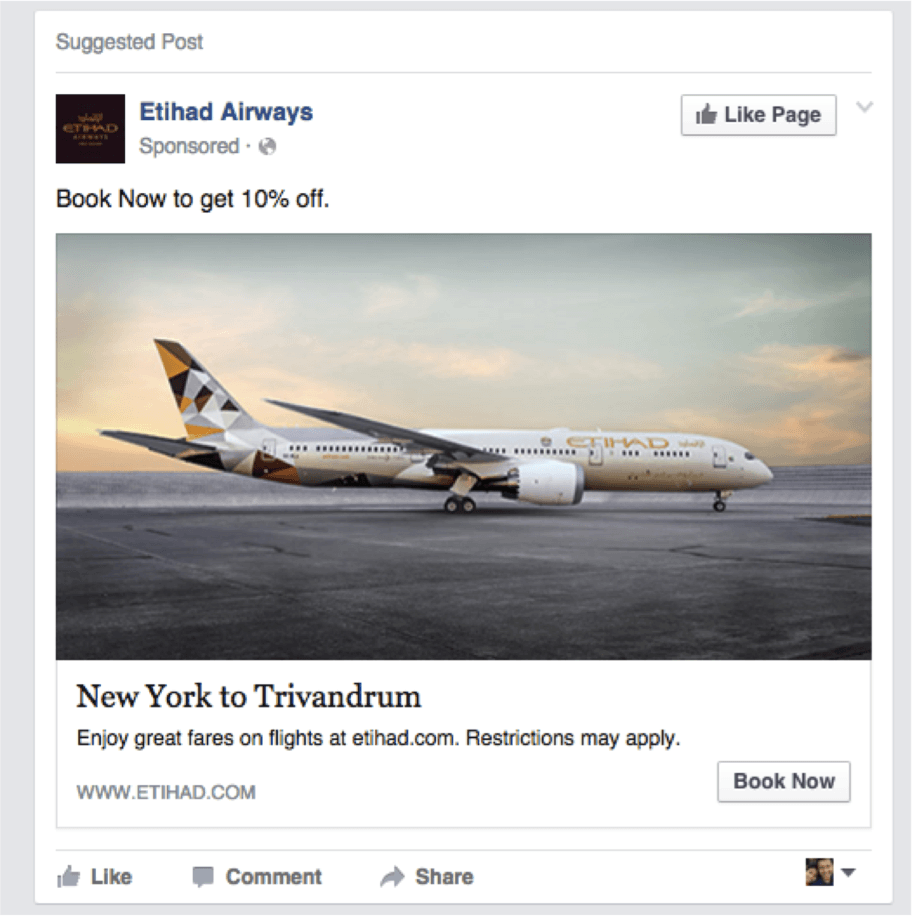
Finally, I thought I should try searching prices directly from the Etihad website. To my surprise, it is very close to what Yatra offered me. There comes the marketers mind. I tried to book from Etihad website but again abandoned the transaction at checkout page. I did this on purpose as I saw the Facebook remarketing pixel was loaded.
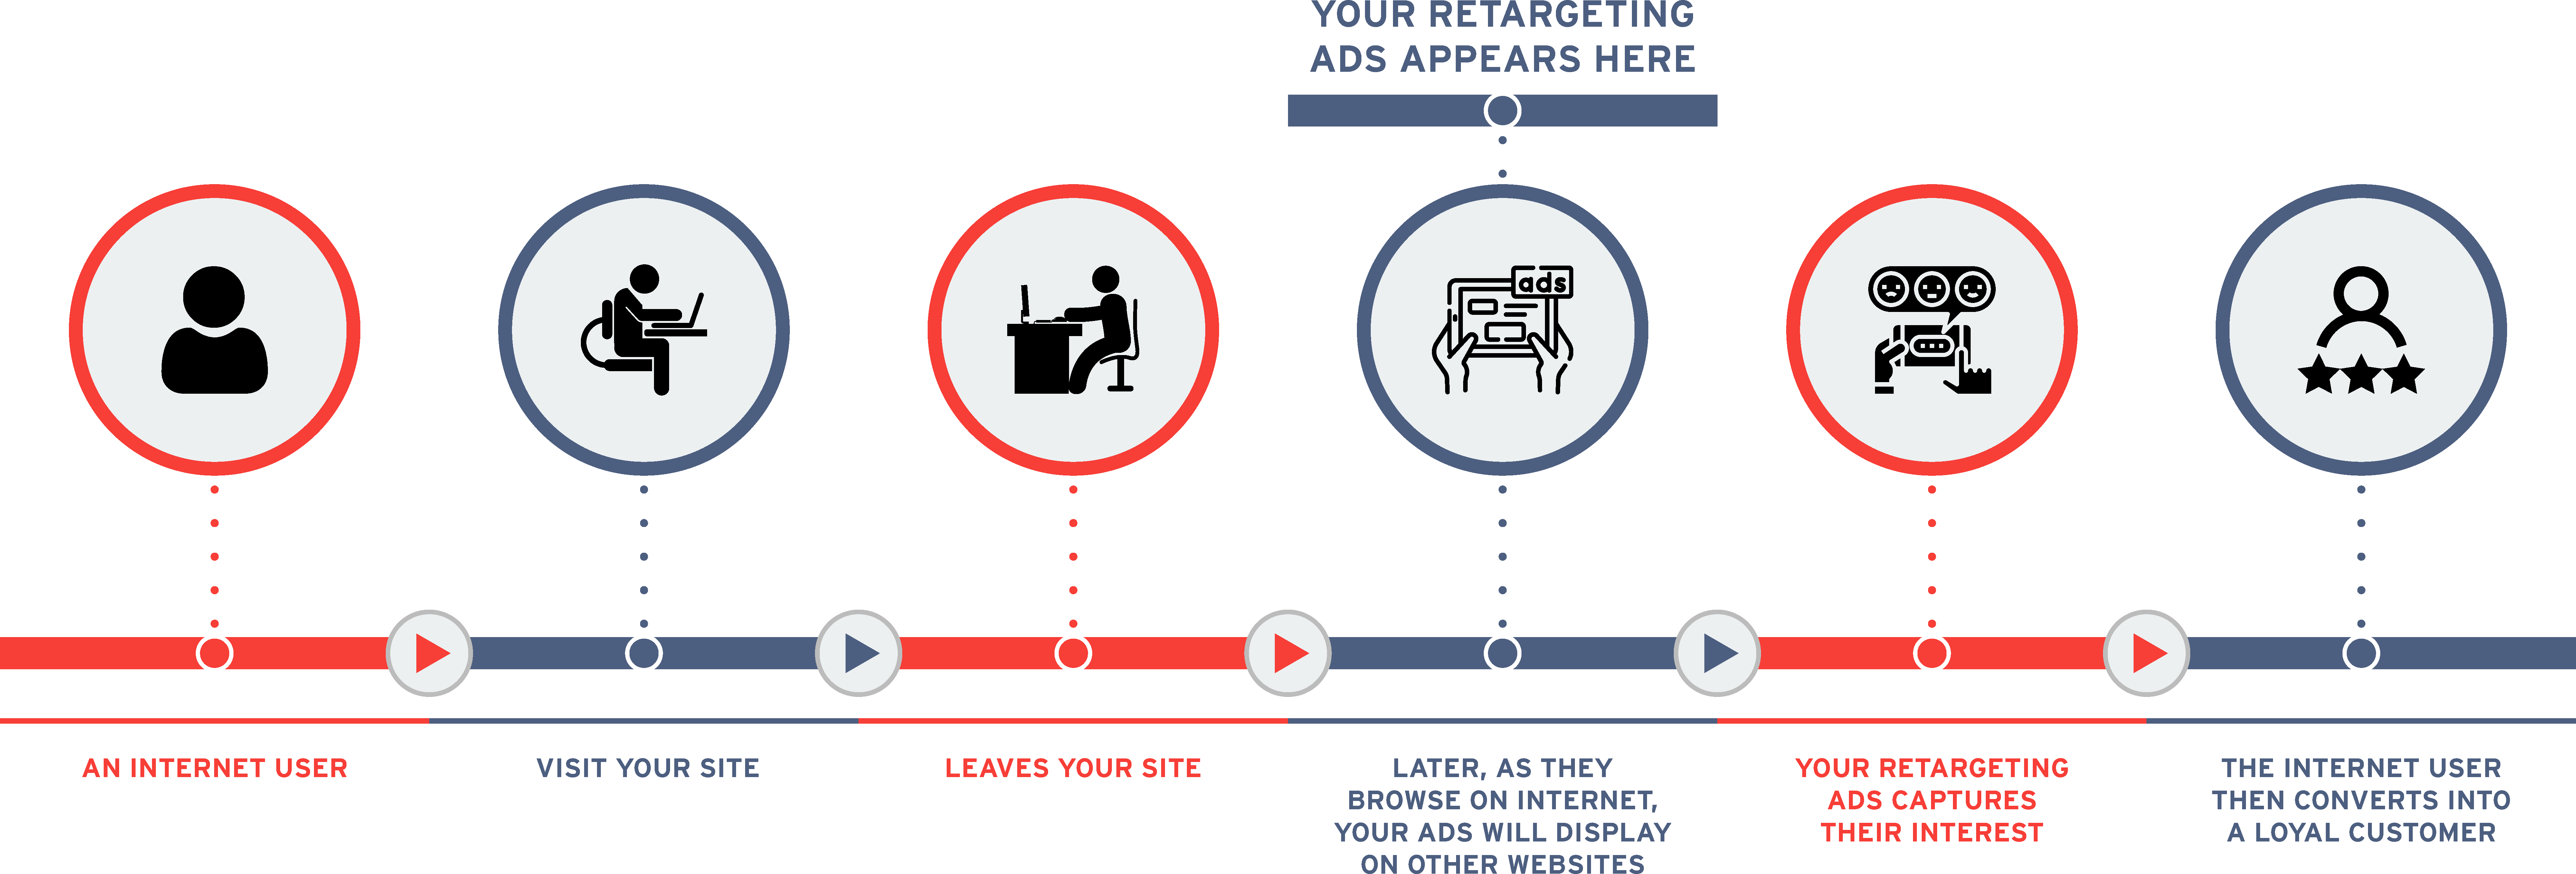
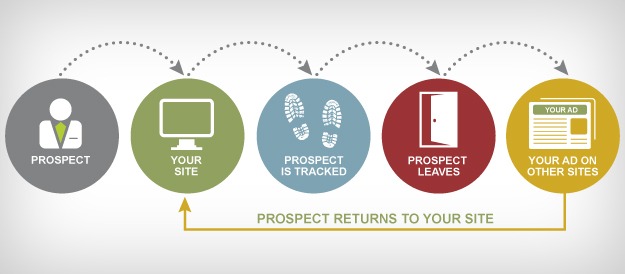
Remarketing is a technique to bring back the visitors who are dropped from the website without completing an intended goal. The image given below explains the remarketing process.
I browsed through my Facebook after a couple of minutes. Without any surprise, I got an offer of 10% discount using remarketing technique on Facebook, as given below.
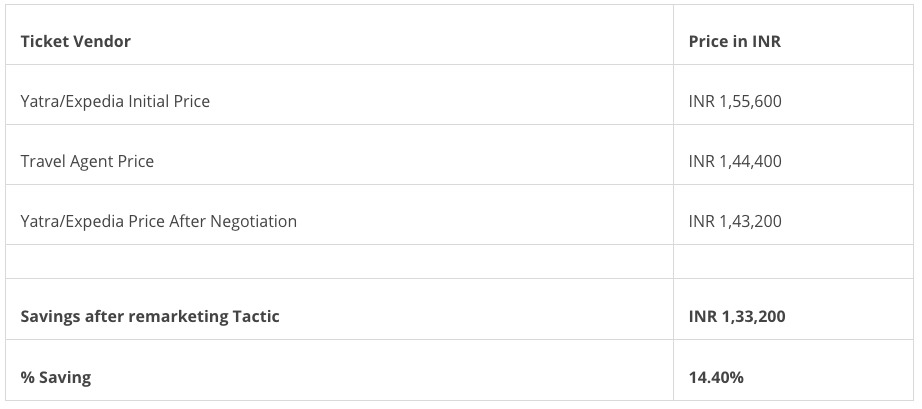
It may sound very fascinating for you, as I was able to save over 14.4% from my initial price. So effectively, I saved around INR 22,400. It is a fairly decent saving for someone living in India. By not doing this process, I would have purchased a ticket at the original price. The detailed savings are explained in the table below. The ticket price includes my wife’s return ticket and my one side ticket.
I have few learnings and advice for marketers as well as the Etihad marketing team. Firstly, I should appreciate the Etihad marketing team for giving me the discount, as it would have gone to an agent if I booked elsewhere. I have a word of advice for Etihad marketing guys. I still have the ad appearing on my Facebook even after completing the transaction. I think they should remove me from the audience list.
Learning and recommendations
- Never book an air ticket without doing enough research
- Remarketing has been one of the greatest tool used by marketers to bring user who has visited the website before. Use it cautiously and don’t annoy users and give clear benefits to bring the user back.
- Discounting is a great way to activate an incomplete transaction, but there are perils attached to it if not used wisely.
- No machine learning system could beat human intelligence. The human brain is hardwired to beat and overcome even the toughest situations.
- Marketers should think of many user journeys and micro-moments to utilise the opportunities to engage prospective buyers.
- If you are doing remarketing, you should build many user journeys as you could, so better targeting and consumer engagement are possible.
- Make sure the user should be removed from the audience list once the visitor completes the purchase.
So, next time you are trying to book travel tickets online, try to research, or simply use the method outlined above. It will surely save you some good money!
This article originally appeared on Track.in
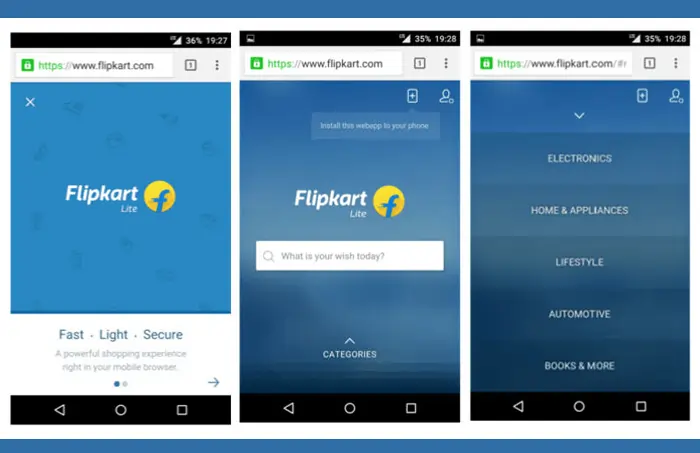
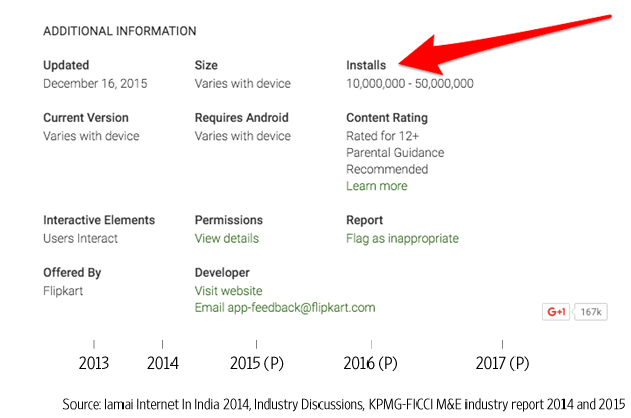
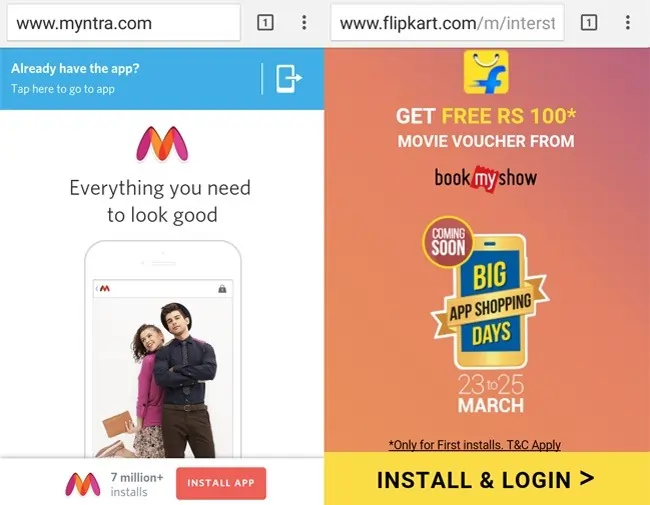
Lessons From Re-launch Of Mobile Website of Flipkart’s from App Only Strategy
Flipkart re-launched their mobile website on November 10, 2015, ditching their ‘app only’ strategy they have announced in early 2015. We had covered why this was a bad move when they did it. We thought to do a follow-up post and look at the importance of creating the omnichannel customer experience.
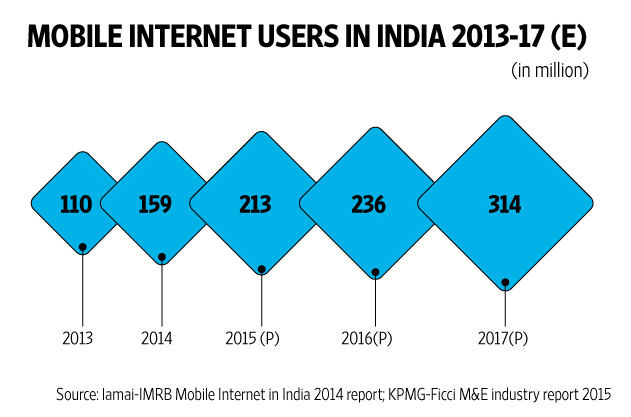
India is accruing mobile Internet users. A new report by Internet and Mobile Association of India (IAMAI) and consultancy firm KPMG projects the number of mobile Internet users in India will double from the figures in 2014 and cross 300 million by 2017.
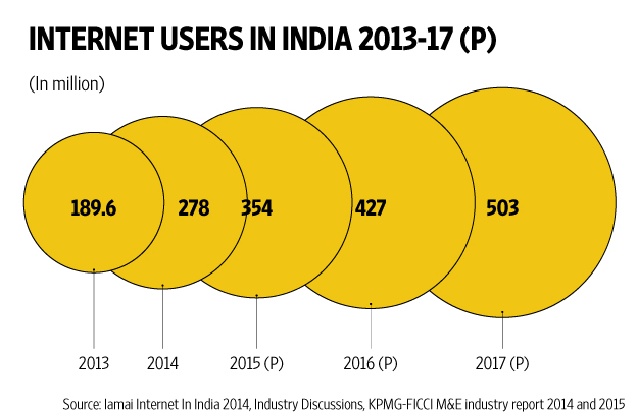
The same time, Internet users in India will almost double from 278 million in 2014 to cross 500 million in 2017.
Here are a few questions to ask:
- For all the mobile Internet users who aren’t ready to install native shopping apps, which is to serve them?
- Who is to serve all the 500+ million Internet users- a fair share of them being omnichannel (mobile, desktop, tablets, etc.) Internet users?
- Who can afford to ignore the user journeys and user behavior in a competitive market where there exist players like Amazon with deeper pockets?
- Is it all about shaping the user experience and being there for them ‘where the customers are’ over ‘here is the only platform from where we are selling, come to us if you may’?
- In short, the customer first strategy is always most important than holding full control of the ecosystem?
For all the mobile Internet users who aren’t ready to install native shopping apps, which is to serve them?
A fair share of the ‘mobile first’ Internet users are on entry-level smartphones and for the storage space is an important issue. One would be able to decide if they need to keep a shopping app that they may use once or a couple of times a month over pictures or videos that matter. Installing the app each time just to make a purchase isn’t logical either- especially when your customer is on a ‘metered’ or a slow Internet plan from Tier 2 or 3 cities; and could also possibly skew the analytics, mimicking the new installs for a new user.
Customers will want to avoid installing an app to make a purchase when they have the choice to do that without installing the app. It’s important how brands handle impulse purchases.
Who is to serve all the 350+ million Internet users- a fair share of them being omnichannel (mobile, desktop, tablets, etc.) Internet users?
While there are over 200 million mobile Internet users, there is a lot of latitude from the bigger 350+ million Internet user pool where the mobile Internet users fall by. Serving customers omnichannel important- brands cannot ignore customers in other channels (desktop, mobile web, etc.) and to overlook the buying conveniences the customers have with a different channel they are not willing to serve. For example, customers prefer buying or to have a ‘bigger screen’ experience for products on a desktop prior to the purchase over buying or to ‘experience’ the same product on a smaller screen. This is why the desktop website is equally important. It’s a consensus that the true winners will be for brands that are ready to provide experiences multi-channel.
Who can afford to ignore the user journeys and user behavior in a competitive market where there exist players like Amazon with deeper pockets?
E-commerce players based in India has another 500-pound gorilla in the room to deal with- Amazon. The one that has deeper pockets, big data expertise in orders of magnitude greater than Google or Facebook when it comes to customer buying behavior, recommendations, understanding into what people actually buy, or what they might want to buy soon. Again, the trove of information Amazon sits on about individuals’ product views, purchasing, and product review histories with the ability harness the data for better conversions means Indian players cannot afford to miss valuable user behavior data they are to accrue from other channels.
Understanding the consumer journey is essential to create better experiences and refine them. You would be leaving millions on the table for the one decision to only serve from a single platform. Flipkart’s Android app page shows that it falls by the 10-50 million app installs slab (one would also need to consider the not-provided estimates of the ‘uninstalls’) the numbers clearly tell us how much more room they had to cater for when the mobile Internet users are 213 million for 2015 even that we add the app installs for other mobile OS platforms. Again, the desktop has it’ share in the consumer journey and the close understanding of Indian digital consumer behavior requires multi-channel efforts- serving customers from the desktop website cannot be ignored.
Is it all about shaping the user experience and being there for them ‘where the customers are’ over ‘here is the only platform from where we are selling, come to us if you may’?
Brands that stand to put customers ahead of anything else in shaping their experiences need to serve them from channels where their customers are. Catering from a single channel, ignoring customer conveniences and the micro-moments of users and to have them come to where you are instead to be there where they are, can never shape good experiences or loyalty when purchases happen over multiple devices, and customers require a seamless experience across each platform.

Apple Brand Is Built On The New Science Of Customer Emotion
Customer satisfaction has been the most critical factor in building a brand traditionally that helps your business grow. Business seeking growth invests significantly in improving customer satisfaction at every touchpoint. A lot of digital transformation programs focussed on enhancing customer satisfaction and expect an increase from the program. But studies show it is not enough to bring growth for the business.
A study conducted by HBR (Scott Magids, Alan Zorfas, Daniel Leemon, 2017) shows it is essential to connect your customers emotionally to increase revenue and profitability. Emotional branding is 52% more valuable than those who are highly satisfied.
How customer emotion influence is so valuable and what are they
1. They tend to buy more
2. Visit you more often
3. They are less price-sensitive
4. They pay more attention to your communication
5. They follow your advice
6. They recommend your brand to their network
Some of the examples of emotional motivators are given below.
| I AM INSPIRED BY A DESIRE TO: | BRANDS CAN LEVERAGE THIS BY HELPING CUSTOMERS: |
|---|---|
| Stand out from the crowd | Project a unique social identity and be seen as special |
| Have confidence in the future | Perceive that the future is better than the past. Have a positive picture of what is to come. |
| Enjoy a sense of well-being | Feel that life measures up to expectations and that balance has been achieved; seek a stress-free state without conflicts or threats |
| Feel a sense of freedom | Act independently, without obligations or restrictions. |
| Feel a sense of thrill | Experience a deep inward feeling, overwhelming pleasure, and excitement, participating in fun events. |
Based on an article by Scott Magids, Alan Zorfas, and Daniel Leemon. © 2017 Harvard Business School Publishing. All rights reserved.
Case Study – Apple brand is built on the new science of customer emotions
The creative visionary late Steve Jobs always wanted to make a brand by maintaining secrecy surrounding the brand. The hype surrounding their product releases by focusing on brand advocates; creating conversations among both techies and non-specialists alike. The brand has always positioned itself as a “Think different” approach and makes an identity based on it. It creates a sense of identity to stand out from the crowd. Steve Jobs had always been vocal about calligraphy lessons he had always helped him to build a unique identity for his first product.
The aesthetically beautiful products created have enabled the Apple brand to be associated with luxury in the eyes of its followers. The consumers are ready to pay a premium to Apple products which are driven by emotional marketing not the actual value of the product.
Most of the Apple product ads, you won’t see they talk about features or technical features, they make ads to convince tool as an ultimate tool for your life. They sell their product by assigning feelings to the idea of owning it. An example is the iPad Air ad, which shows a pencil on a table with different surroundings until they pull up iPad Air from its behind.
Apple chooses not to mention any features of their new product, yet convince their audience that this is the ultimate tool for creativity. They sell their product by assigning feelings to the idea of owning it. The crux of this advert is not that the iPad is as thin as a pencil, but instead that it opens as many creative doors. Most of the Apple ads follow similar tactics that create a Feel a sense of freedom.
Ecosystem of products
Apple has always been focused on creating products that only work on their ecosystem with their network of products. It allows Apple to make revenue streams because the fans have a sense of feeling that they are buying the most excellent product in the industry. Even without ever mentioning product features, it takes users a matter of minutes to discover how to connect and sync Apple devices. The more Apple products you own, the more benefits there appear to be; apps, music, and videos are all in one place and are accessible on every device.
Every year Apple launches a new iPhone with new things which are already existing in the market packaged nicely. Apple emotion puts customers at the center of everything they design. Consider this; the brand identity is created that makes thousands of people camping outside their stores overnight to pick up a pre-ordered product? Users can have the latest, newest iPhone without having to learn anything new. Open the box, turn it on, and after signing up, you’re ready to use it in precisely the same way you’ve been using your previous phone.
Optimize all touchpoints and functions
It’s critical to optimize emotional connection across all tasks and touchpoints—from product development and marketing to sales and service. Major investment areas are stores, online and omnichannel experiences, merchandising, and message targeting.
Opportunity
There’s a lot of value left on the table and a tremendous opportunity to transform satisfied customer emotion connected ones, and when companies discover that, they find a new source of growth waiting to be tapped. It is important to take a systematic approach, and there is not a predefined formula to build a brand to make an emotionally connected customer. So it is vital to apply tactics, measure, and learn lessons. It is also challenging to measure emotionally connected customers and the growth of the organization. Some of the key metrics to be considered are lifetime value measures such as annual spending, churn, and tenure.

Optimizing Businesses For Better Google Near Me Listings
Near me is a search phrase that throws up accurate and relevant local listings for an establishment or service by Google. Let’s say a user types in ‘hotels near me’. Google will surface the most relevant local listings of hotels near the user’s location.
I recently traveled to Philadelphia’s Old City and wanted to find a good restaurant. I typed ‘restaurants near me’ on Google and it showed up a list of establishments around me, ranging from restaurants serving American cuisine to those specializing in fusion dishes. Such is the power of near me and for many travelers, it can be a life-saver.
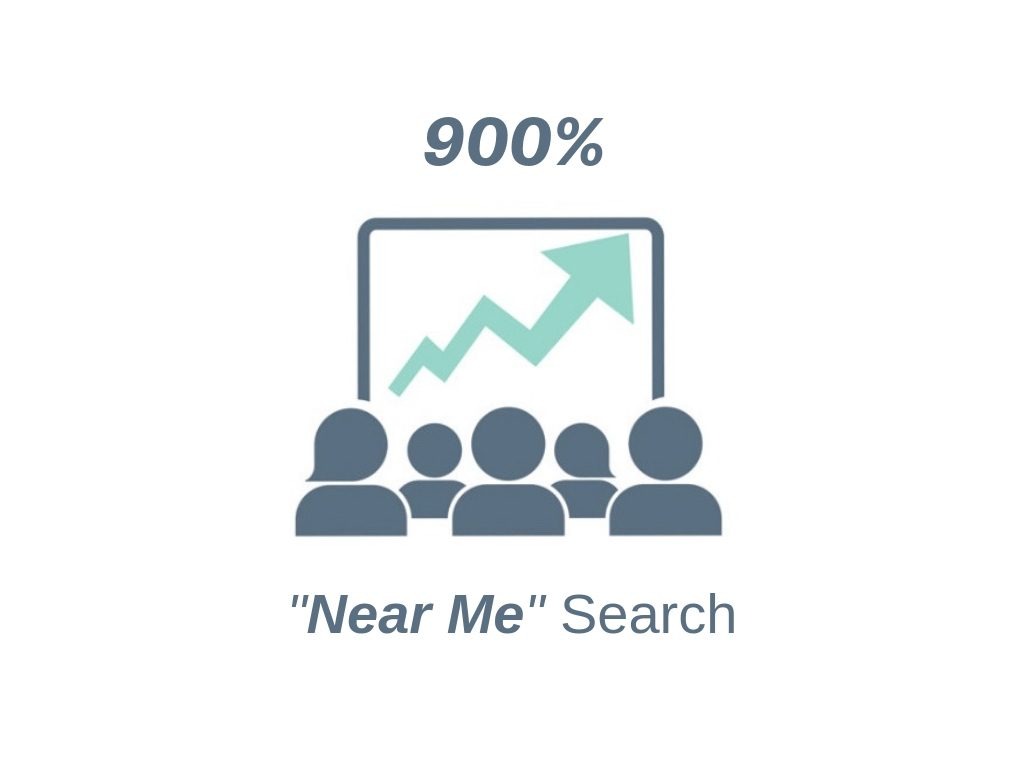
‘Near me’ searches have grown exponentially. According to Google, mobile searches for ‘near me’ grew a whopping 900%+ in the last two years. The searches are becoming more specific and customers are looking for relevant answers. What does this mean for businesses? In order for yours to rank high in local search results, it’s important to understand how ‘near me’ works and how you can optimize your website for higher rankings.
How Google Decides Local Rankings For Businesses
If you have a business, you can’t control when you will show up in ‘near me’ results. However, you can make changes to increase the possibility of showing up. Entering a search for ‘near me’ reveals results based on several factors. There’s a simple reason for this – ‘near me’ searches don’t only depend on how close your business is to the search query. Google does factor in the distance first but it also combines relevance and prominence to determine the most appropriate results. For instance, if Google decides that a business located farther away than yours has what a user is looking for, it will rank it higher than yours in local results.
Distance
Distance refers to how far a potential search result is based on the location of user inputs. If a user doesn’t specify the location, Google will determine the distance based on the user’s whereabouts.
Relevance
Relevance is the next factor Google’s algorithm uses to decide the most appropriate local listings. One of the ways that your business can rank higher in search is to provide complete and detailed info about its services. This helps Google understand your business so that it can match it to search queries.
Prominence
Like the offline world, a business’s prominence plays a vital role in deciding how relevant it is to a search query online. For instance, if yours is well-known it will rank higher in local listings than one that isn’t prominent. This is why it’s common to see certain landmarks, hotels, restaurants and popular establishments listed in search results. However, this prominence is not based on online popularity alone; Google also takes the offline status of these establishments into account.
Positive ratings and reviews of establishments help push them higher up local listings. Google searches links, directories, articles and the like to find out which places are well-known and well-liked. Since search engine optimization (SEO) plays a part in search results, employing sound SEO optimization can make a difference in how well your business shows up in search results.
How To Make Your Business Rank Higher In ‘Near Me’
Competing with popular establishments takes some work. The good news is that it doesn’t cost a lot and can be easily achieved with some changes. Here’s how –
Use Smart Keywords But Not ‘Near Me’
While ‘near me’ is a keyword used to find local listings, it can’t be employed in web copy as it would sound awkward and forced. The next best thing is to use keywords like ‘near’ [street address], ‘nearby [landmark]’ etc. You can start employing these keywords in your About Us and location pages. You should also embed your Google Maps location and provide written driving directions to your business. Web copy should also have other information related to your business’ product or service. For example, if your business liaises or cooperates with the local community you should have content pertaining to the groups and organizations you work with. Additional information in the form of blogs enrich your content and can help increase search rankings.
Optimize Google My Business
Provide complete information on Google My Business as it will help your business show up on local listings. Mention your business’ full address, services, operating hours, photographs and anything relevant. If there’s a change in working hours or your office remains closed on certain days, mention that too. Keep in mind that users can suggest edits and upload photos of your business. Regularly monitor the information given along with that provided by users. Make changes if necessary so that your info remains accurate and updated.
Encourage Online Reviews And Ratings
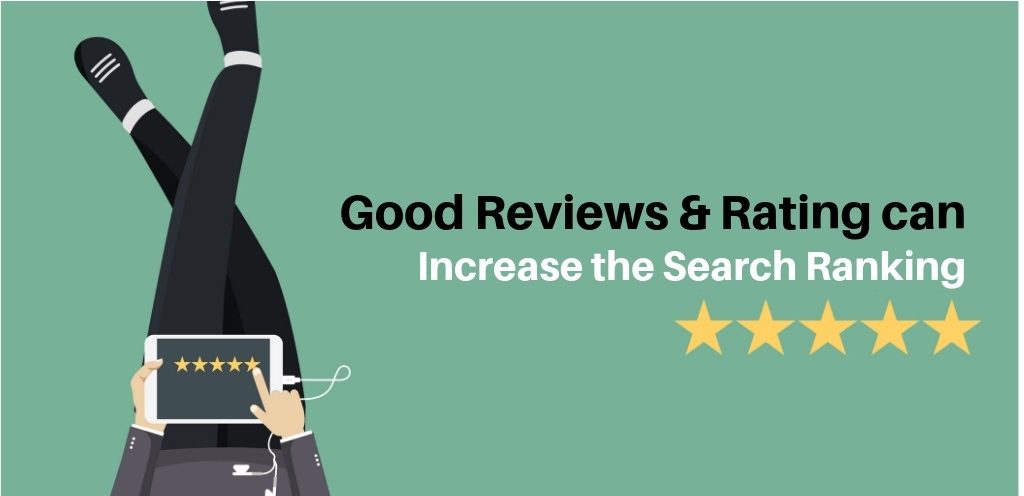
We’ve mentioned that good reviews and ratings can increase search rankings. Google wants to provide the best results and best search experience for its users, so it’s unlikely that businesses with poor user ratings will rank highly. You can start by asking users for their opinions and responding to the same, whether they’re negative or positive. Emails are the best way to seek reviews. With a well-designed email campaign, you can get the results. Google My Business provides tips that business owners can use to respond to reviews and ratings. Some of them include being polite and not getting personal, keeping replies short, thanking reviewers and avoiding sales pitches. There is review management software such as Podium that you can use to simplify customer interactions and help your business get better reviews.
Consider Other Local Directory Listings
It’s important not to focus only on your website or Google My Business but to expand to other local directory listings. When I searched for studio apartments near me, I found that websites like Groupon and Yelp ranked higher in organic results. Listing management software like Moz Local can help your business rank higher across various local directories and content aggregator websites such as YP.com, Yelp, Better Business Bureau and Apple Maps. They do this by making sure your information is accurate and up-to-date. This keeps your business relevant to search queries.
Optimize Using SEO
SEO optimization is a necessary practice for any business to boost search rankings. While ‘near me’ searches are important and your website should be optimized with this in mind, your overall SEO strategy should be to provide useful, relevant and updated content. The user is focal and providing the best user experience will help your business gain trust and authority with search engines. Blogging on your website about your product/service and guest blogging on outside websites can also bring authority & trust.
In 2010, there were 62 million smartphone users in the US. It’s estimated that the figure will reach 277 million by 2021. Combine that with the number of ‘near me’ searches and you have a good idea of just how important it is for businesses to rank high in local listings. Consider the strategies given here to optimize your website and attract potential customers.
If you’d like to discuss SEO strategies for local businesses in more detail, give us a call.

How To Increase Your Social Media Engagement With Images And Videos
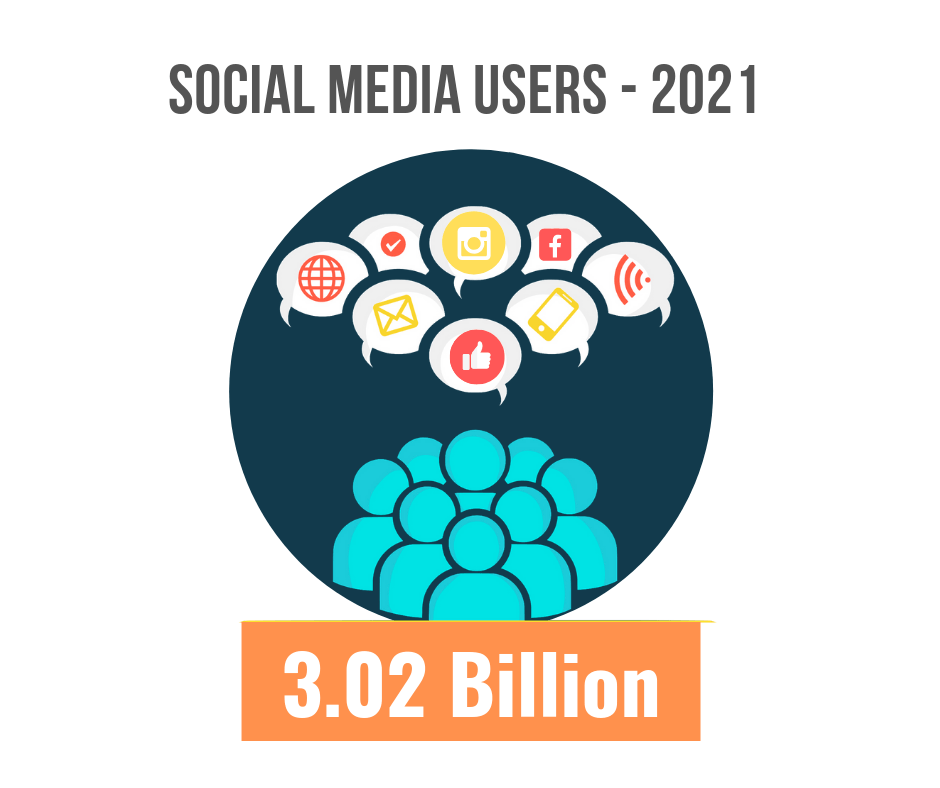
A picture is worth a thousand words, goes the adage, and the digital world firmly believes in this. In 2010, there were about 0.97 billion social media users. By 2021, that figure is projected to touch 3.02 billion. The massive rise in the number of social media users has companies and brands racing to stand out. There’s a never-ending rush of content and it’s challenging to get noticed. However, there are two things that can up the odds in your favour – images and videos. We live in a highly visual world and using the right images and videos can ensure your brand stands a cut above the rest.
According to the content marketing expert, Jeff Bullas, there’s a 37 percent higher level of engagement for images over text on Facebook. Meanwhile, Cyndi Knapic of Animoto reported that 64 percent of consumers stated that watching a marketing video on Facebook influenced their purchase decision in the last month. 52 percent of consumers also said that they preferred edited video over live video. Those are significant figures and a wake-up call to brands looking to increase their social media engagement.
Fool-proof Strategies To Double Social Media Engagement
1. Use High-Definition Images In Posts And Updates
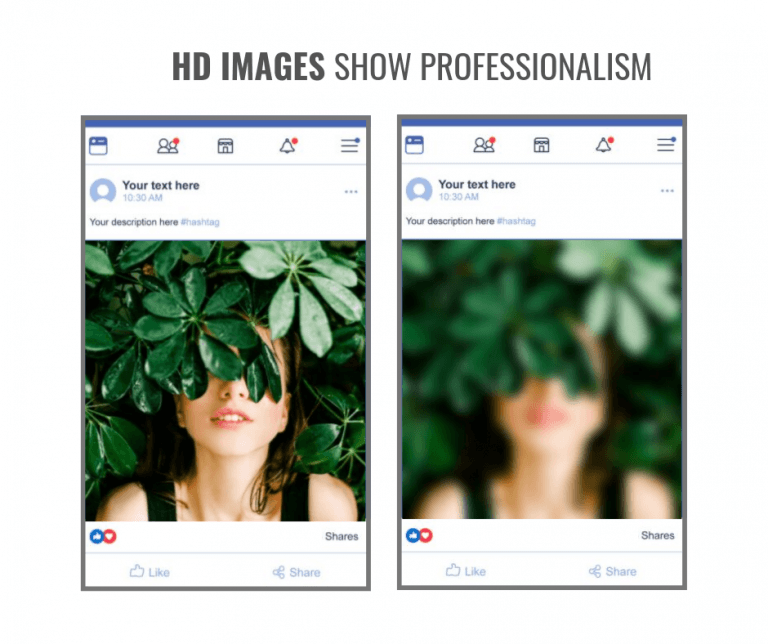
Gone are the days of grainy photos. These days, it’s all about high-definition images and great visuals and using them to communicate your voice. Back then, mobile phones and laptops lacked HD displays and it made sense to use low-res images. However, things have changed. Today, smartphones support HD displays so using low-definition images is no longer necessary. High-definition images show professionalism, set the tone for your brand and increase social media engagement. Use a variety of them to keep users engaged. Scripted photos, candid shots, and memes are some of the things to include in posts and updates.
2. Scale Images Across Social Media Platforms
Social media platforms have different image formats. What works for Facebook doesn’t do great on Instagram and vice versa. Once you’ve chosen images to be used for your brand, they need to be resized to cater to these formats. This makes them look presentable and ensures that the concept you’re trying to convey resonates with your audience.

There’s a bigger factor at play too. Sharing the same size images across various platforms can result in them being cropped. For instance, an image you post on Facebook will automatically be cropped on Instagram as it has a different image size requirement. You could end up losing important info you’re trying to send your audience such as discounts, coupon codes, etc. You’re more likely to get responses if you convey your message in full at the outset. If not, users will scroll past your post and you’ll miss the chance to convert leads into sales. There are several tools that can resize images for you and make quick work of it. Landscape by Sprout Social and Promo Instant Image Resizer are a couple of them.
3. Repurpose Content Into Videos

Making videos sounds expensive and time-consuming and it can be. However, as a marketer, it’s about working smart and one way to do this is to repurpose existing content into videos. There’s no need to make videos from scratch either. There are apps such as Lumen5 that can do the needful. It pulls the most important sentences from a blog post you select and it creates a storyboard. All that’s left for you to do is to adjust it and add images and music to the video. You can then share it on your website and social media platforms. You save a lot of money and, of course, time. An Animoto survey found that 92 percent of marketers did just this. The top channels where consumers watch branded video content are on Instagram Stories, Facebook and Snapchat so start with them.
4. Optimize For Mobile Viewership

The Animoto survey also said that 81 percent of marketers optimized social videos for mobile viewership. This is necessary because nearly half of social media users prefer accessing social media on mobile phone apps. 92 percent of mobile phone video consumers share videos with other people while 7 out of 10 millennials are likely to watch brand videos when shopping online. If images and videos aren’t optimized for mobile viewership, they won’t be able to say what they’re supposed to.
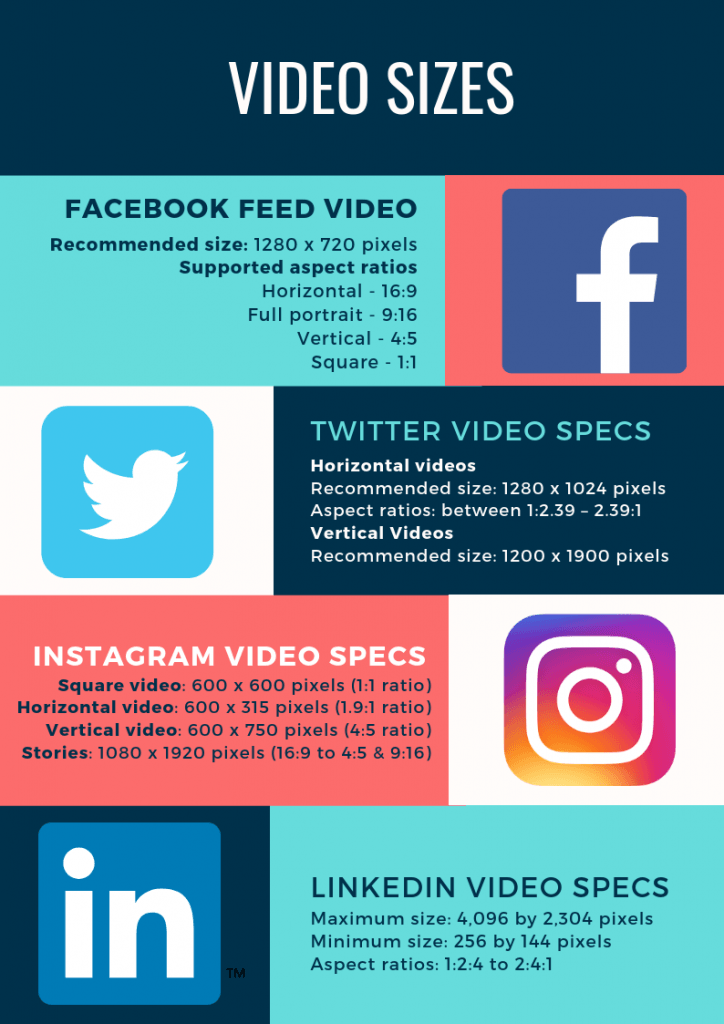
Vertical or square video formats (so users don’t have to flip their phones), enabling sound-off viewing, etc. are ways you can optimize videos for mobile phones. It’s important to stick to the recommended video sizes for mobile as well. For instance, you can use a 1:1 or 4:5 aspect ratio for Facebook and Instagram feeds but a 2:3 ratio only works on Facebook. It’s important to keep videos short too. Statistics show that 60 percent of video viewers stop watching by two minutes. Meanwhile, 20 percent click away in 10 seconds or less. Creating videos with relevant content in the first minute and a half or so means that you convey your message before viewers stop watching.
5. Harness The Allure Of Stories
Social media stories are on the rise and more people are using them than before. Facebook, Instagram, and Snapchat all have the feature. They’re viewable for 24 hours before they disappear. YouTube has also started Stories although they last for 7 days. The feature is currently in beta mode and is available for eligible channels that have over 10,000 subscribers. In 2018, former Facebook chief product officer, Chris Cox, said that ‘the Stories format is on a path to surpass feeds as the primary way people share things with their friends sometime next year’. This, and the evidence – more than 1 billion users use Stories – point to how brands need to harness the allure of this feature.
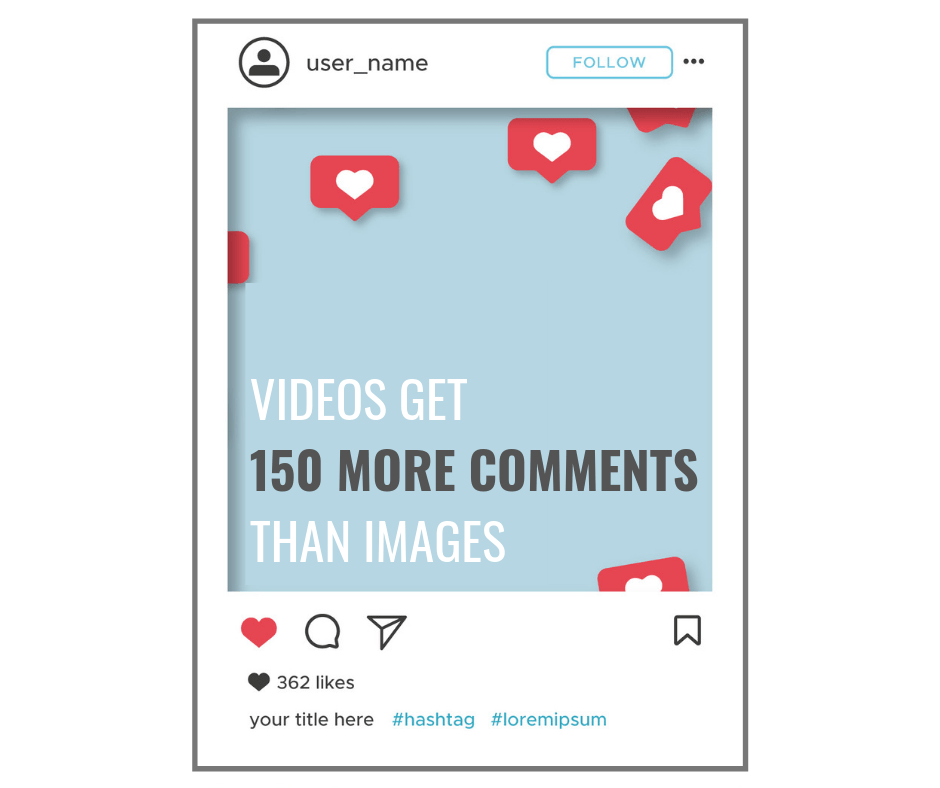
According to an Instagram Engagement Report released by mention.com, videos are the most effective types of content on Instagram. They generate an average of 150 comments compared to 65 comments for image posts. While utilizing Stories is basically now a requirement for brands to connect with their audience, there’s a way to go about it. Forget direct sales pitches and aggressive marketing; brands need to be creative, informative and tell stories that users will remember. Highly scripted stories don’t resonate as well either. They need to be less polished and more casual.
Social media is disrupting the way companies do business. Targeted advertising, real-time customer service and transparency are just some of the ways it’s done this. Brands can increase engagement by resharing images and videos in social media groups. Posting content during peak engagement time can also affect engagement. For instance, the best time to post on Facebook is Wednesdays at 11 am and 1 pm. For Instagram, it’s Wednesdays at 11 am and Fridays at 10-11 am. Twitter’s best time is Wednesdays at 9 am and Fridays at 9 am. Consumers have taken center stage and the influx of content means brands need to step up their game. It’s exciting albeit challenging time and it’s important to stay up-to-date on changing trends.
If you’re interested to double your social media engagement, give us a call.

Google Tag Manager
Trying to manage too many website codes with no success? Google Tag Manager (GTM) is here for the rescue!
GTM is a tag management solution that allows easier and quicker implementation of multiple tracking, conversion, and remarketing tags across your website and mobile apps without the assistance of a developer. Moreover, with the help of GTM, you can insert and manage multiple pages of a website from a single point.
Our GTM Experts have put together a simple infographic to help you understand more about the nuances of Google Tag Manager. Read on…!
Let us help you implement Google Tag Manager on your website, book a time with our inhouse Tag Manager expert here.
.webp)
The Death of 3rd-Party Cookies: Benefits of Google Server-Side Tagging
Safari and Firefox have already started blocking 3rd-party cookies, and marketers are facing acute data tracking and measurement problems.
By 2023, Google Chrome will also disown 3rd-party cookies. The data loss from Safari and Firefox is already blinding (22.24% combined market share), and with Chrome (64.53%) following the suit, brands and markets need to run ahead and prepare for the change. It is not just the third-party cookies disappearing, but a huge source of consumer data and insights.
There is good news. Google Tag Manager Server-Side Tagging can help fix the data holes and measurement issues. Additionally, GTM Server-Side Tagging comes with additional benefits as well.
Google Tag Manager Server-Side Tagging
For tracking, websites and apps historically use a client-side tracking solution. In this method, a tag is set up that collects the data from the user’s browser (client) and directly sends this to individual tacking service providers like Google Analytics, Google Ads, Facebook, etc.
Client-Side Tracking In Action
Server-Side Tracking In Action
Let us also understand the key differences between client-side tracking and server-side tracking:
| Client-side Tracking | Server-side Tracking |
|---|---|
| Browser-based tracking | Website’s cloud server-based tracking |
| Is set up via client-side tagging. For example, Google Tag Manager | Is set up via server-side tagging. For example, Google Tag Manager Server-Side Tagging |
| Third-party javascript code is added to the website to track users | No third-party javascript code is added |
|
|
| Unreliable tracking option as a good part of third-party cookies get blocked | Reliable tracking and measurement option |
| Not compliant with privacy regulations | Compliant with privacy regulations |
As you can see, the server-side tracking is the future.
To switch from client-side tracking to server-side tracking, brands need to move all the tracking pixels to Google Tag Manager Server-Side. This includes all your current tags Google Analytics, GA4, Google Ads, Facebook, etc.
In the case of server-side tracking, the brand will be able to run all the tracking scripts directly on the brand’s cloud server instead of running them in the user’s browser. In this manner, brands can convert third-party cookies to first-party cookies and thereby stay compliant with data protection and privacy laws like GDPR and CCPA.
Benefits of GTM Server-Side Tracking
On the tracking front, Google Tag Manager Server-Side Tagging circumvents tracking restrictions and offers reliable tracking.
On the measurement front, it helps fills the earlier data gaps in the conversion paths, which has historically made it difficult to understand the customer’s purchase journeys and advertise to them profitably.
On the data privacy compliance and regulations front, GTM server-side tracking is compliant with GDPR, CCPA and is able to successfully convert third-party data to first-party data.
More Benefits of GTM Server-Side Tracking
- Faster site performance
- Transform 3rd Party Cookies to 1st Party Cookies
- Reliable tracking
- No more data holes in analytics measurement
- Full control over the data
- Content-security policies
- Hide sensitive data: tracking IDs, secret API keys
You can find more information about Google Tag Manager and Server-Side Tagging here, and you will be able to download our free whitepaper, Analytics and Measurement in the Cookie-Less World, Background to Google Analytics and GTM Server-Side Tagging on the same page.
Creating New Custom Channel Groups in GA4
With the recent introduction of custom channel grouping, Google Analytics 4 (GA4) has become an even more powerful tool for tracking website traffic and user behavior. This new feature allows users to build personalized channel groups, either from scratch or by using Google’s default channel group as a foundation, giving them the flexibility to modify channel names, fine-tune channel criteria, and add or delete channels to achieve broader or more targeted perspectives on their channel data. This article will explore the concept of custom channel groups, their advantages, and how to use them in GA4. We’ll also discuss the advanced features they provide.
What are Custom Channel Groups?
Custom channel grouping involves categorizing website traffic according to the marketing channels that generate it. This is done by applying predefined or user-defined rules to track their impact on overall website traffic. While Analytics offers a default channel group of predefined channels, such as Organic Search, Direct, Social, Referral, and Email, custom channel groups allow you to tailor your traffic grouping based on your unique marketing channels, such as affiliate marketing or paid social campaigns, and to apply them to standard Google Analytics reports.
Advantages of Custom channel groupings:
1. Improved Reporting:
Custom channel groups offer marketers a more precise and granular level of data analysis than the default channel groups. This enables marketers to identify improvement areas and optimize their campaigns accordingly. In addition, by creating custom channel groups, marketers can generate reports that provide more meaningful insights on the performance of different marketing channels and their contribution to website traffic.
2. Better Attribution
Custom channel groups offer marketers a powerful tool to better attribute website traffic to specific marketing channels, enabling them to gain valuable insights into their website traffic and marketing campaigns. By grouping website traffic into custom channel groups, marketers can track the performance of specific campaigns or initiatives and make data-driven decisions to optimize them. You can effortlessly utilize custom channel groups in any report that supports default channel groups as a primary dimension. This includes acquisition reports, custom reports, explorations, and audience conditions. This allows marketers to understand better how customers interact with their website and where they are coming from, especially when running multiple campaigns across different channels. In addition, with custom channel groups, marketers can identify which channels drive the most traffic and conversions, enabling them to make informed decisions about their marketing strategies.
3. More Accurate Insights:
Custom channel groups are a valuable tool for better understanding website traffic and user behavior. By grouping traffic into custom categories, marketers can gain insights into how different channels work together and how users interact with the website. Create custom channel groups to align with your unique marketing goals and strategies. You have the flexibility to choose from a wide variety of dimensions, including source/medium, campaign, landing page, device type, location, and more.
Limitations of Custom Channel Grouping in GA4
- Custom channel grouping requires more manual effort to set up and maintain than default channel groups.
- Some traffic sources may not fit neatly into predefined channel groups, and marketers must use their discretion to ensure that these sources are properly accounted for.
- Custom channel grouping may not provide a complete picture of website traffic and user behavior, and it is important to use custom channel grouping in conjunction with other analytics tools to gain a more comprehensive understanding of website performance.
- The accuracy of custom channel grouping heavily depends on the quality and consistency of the data collected by GA4.
- Any changes made to custom channel groups will only affect data collected after the changes were made. This means that custom channel grouping is not retroactive.
- Custom channel grouping in GA4 does not support “Last Non-Direct Click” attribution modeling, meaning some traffic sources may not accurately attribute to conversions.
- GA4’s custom channel grouping has a maximum limit of 50 groups per property, which may not be adequate for bigger websites with intricate marketing strategies.
- Please note that the custom channel grouping feature in GA4 may not support all available dimensions and metrics, potentially limiting the detail level you can analyze in your data.
How to configure Custom Channel Groups:
To create a custom channel group in GA4 you will need administrator or editor level access of the property.
- Navigate to the Admin > Property > Data Settings section and then choose “Channel Grouping.”
- Next, Click on the “New Channel Grouping” button.
- Name your custom channel group, and select “Custom” under “Channel Grouping Definition”.
Add a new channel group:
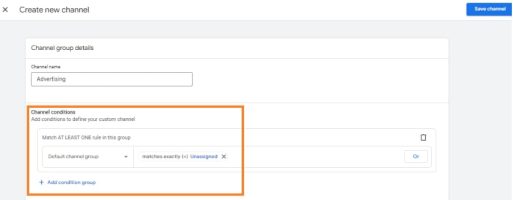
To configure a custom channel group in GA4, give it a name and add a condition. Click “Add condition group” and select “Default channel group” and “Add a condition.”
As an example, you can select “Default channel group” and choose a condition that matches exactly (=)Unassigned. Then click “Apply” and save the channel.
Remove a channel from a group:
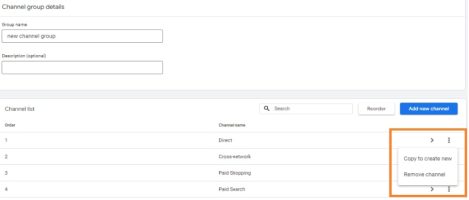
We can specify the groups we want to use to classify our traffic. The default groups are already included as a starting point. Select the three vertical dots to copy or remove a group and click “Copy” or “Remove channel”.
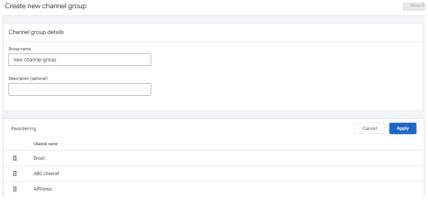
Reorder channels in a group:
You can reorder the channel, meaning whichever channel matched first will be applied to your traffic.
- In the row for an existing group, click >.
- Click Reorder.
- Drag channels to their new locations in the group order.
Click Save Group.
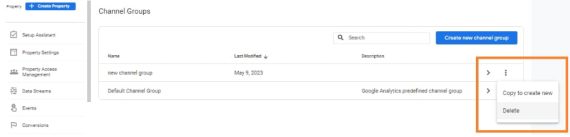
Remove a group:
- In the row for an existing group, click > Delete.
- Click Yes, Delete.
In conclusion,
Custom channel groups in GA4 offer a powerful way to track and analyze website traffic as part of your GA4 implementation. By creating custom categories based on your unique marketing channels, you can gain insights into how different channels perform and contribute to your website traffic. The implementation of custom channel groups in GA4 is relatively straightforward, so it’s worth taking the time to set them up and start reaping the benefits.
Understanding the Difference Between Events and Conversions in GA4
Google Analytics 4 (GA4) is a powerful tool for tracking and analyzing user interactions on your website. Two terms, “events” and “conversions,” are often used, and while they might seem similar at first glance, they represent distinct actions in GA4. Understanding the differences between these two metrics is crucial for effectively evaluating the success of your marketing campaigns.
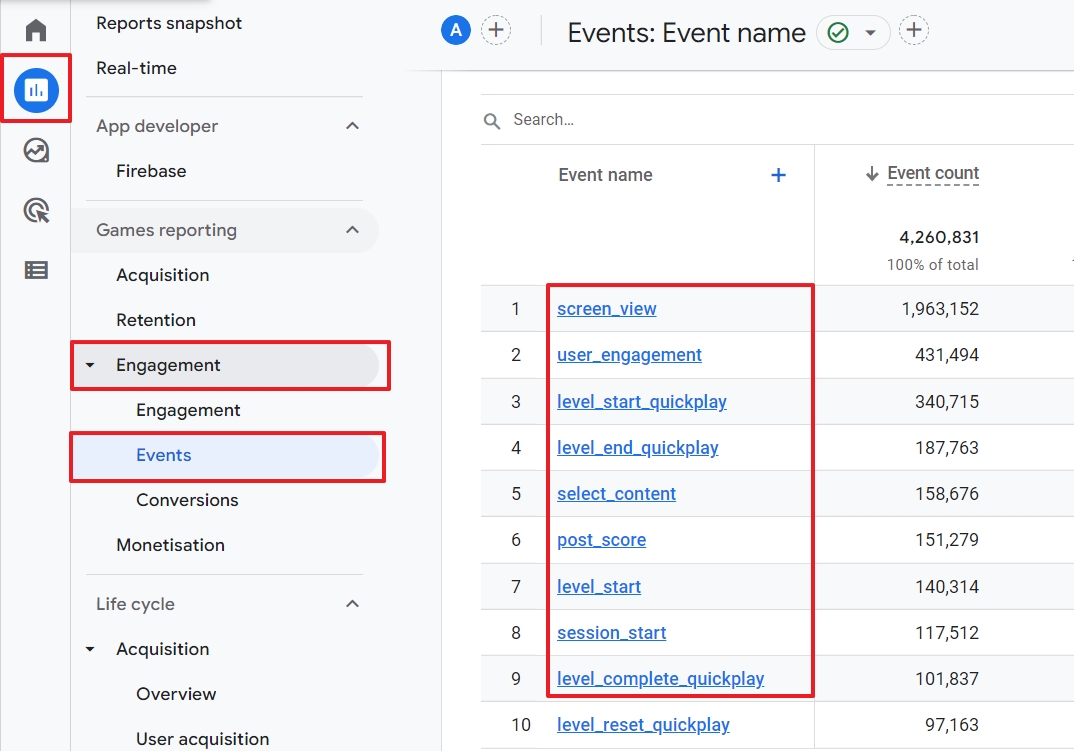
What Are Events in GA4?
Events in GA4 measure specific actions or occurrences on your website. These actions range from button clicks and downloads to purchases, scrolling, and page views. Some events are automatically tracked by GA4, making it easier to understand user behavior. These automatic events include:
- First_visit: Collected the first time a user visits your website, and GA4 uses this event to create the “New Users” datapoint in reports.
- Page_view: Reports page views on the page the user is currently viewing.
- Session_start: Determines when a user’s session begins. After 30 minutes of inactivity, a new session_start event is triggered.
- User_engagement: Engagement is reported when a user spends at least 10 seconds on the website and is collected periodically.
These automatic events cannot be turned off. Additionally, GA4 allows Enhanced Measurements to automatically track other events, including scrolls, outbound clicks, site searches, video engagement, and file downloads. Moreover, you have the flexibility to create custom events tailored to your specific website goals.
What Are Conversions in GA4?
Conversions in GA4 represent significant actions that users take on your website and are deemed necessary to your business. These actions are often critical metrics of success. Conversions in GA4 replace the concept of goals from Universal Analytics.
To measure a conversion in GA4, you must create a custom event and designate it as a conversion. Each conversion you want to track requires a dedicated event. Everyday events marked as conversions include:
- Phone calls
- Destination goals
- Purchases
- Downloads
- Appointment bookings
Some conversions, such as phone calls, must first occur as an event on your site before you can mark them as conversions in GA4.
Vital Differences Between Events and Conversions:
Now, let’s summarize the vital distinctions between events and conversions in GA4:
- Scope: Events capture various user actions, while conversions focus on specific, valuable actions.
- Purpose: Events help you understand user behavior, while conversions measure the success of your business goals.
- Counting Mechanism: Events are counted every time, whereas conversions are typically counted once per session.
- Quantity: Multiple events can occur on a single page, while conversions are usually limited to a few.
- Configuration: Some events can be tracked automatically in GA4, while conversions require manual setup.
By grasping these differences, you can effectively leverage events and conversions in GA4 to gain valuable insights into user behavior and measure the success of your marketing efforts. This understanding will empower you to make data-driven decisions and optimize your website’s performance.
How The Learning Capacity Of Human Beings Vary Listening to Long Lectures?
“Are you with me?”, the obvious way a teacher measures the attentiveness of students. The long-established question takes its place more prominent in classrooms these days. It seems that most of the new generation lecturers find it alarming that getting student attention is increasingly difficult compared to preparing the lecture notes! The lecture hours can last up to 45 to 60 minutes, and what students usually commit to is “poor” attention. Addition to the distractions the present era owes, they brood over in thoughts, fidget or doze off in between, there is only passive absorption of information and apparently, teachers go exasperated. During the start of the lecture, there might be high levels of responsiveness, but as the session progress, you may even see a row of students slumped on their desks or being restless, suggests a drastic drop in attention.
Attention and performance levels vary from student to student, studies indicate that performance can be assessed by;
- The not-scribbled legible part of the lecture notes taken down
- The ability of students to recall the class
- The questions students can answer about the section of the lecture
Continued attention might fluctuate with the quality of the lecture, motivation, emotions, time of the day and other deviating factors. Lecturers involve in different activities to captivate students and increase the span of attention – visuals, video clips, demonstrations, encouraging students to participate in a quick chit-chat, to take a break, even asking to pick the occasional sleeper of the class. Many types of research and surveys state that each student exhibits a different pattern of attention and performance levels, varying with lectures.
Attention graphs on lecture time and student performance can be a modest way to demonstrate it. If we focus on the reports by (Bligh, 1998) it divides into four.
Horizontal Line Graph
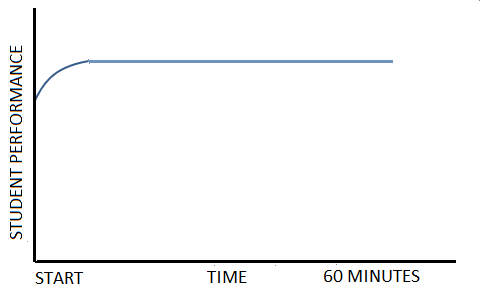
Student attention line in a lecture (Bligh 1998)
The graph shows student performance along Y-axis and lecture duration on the X-axis. This graphical representation reminds us of those beautiful lecture sessions, never to be missed or look for any in-between pauses. The steady horizontal line shows high or unwavering attention span, a rare occurrence indeed. This happens if one is lucky to be that “ideal teacher” or the “captivating orator” which students look up to.
Dramatic Decline Graph
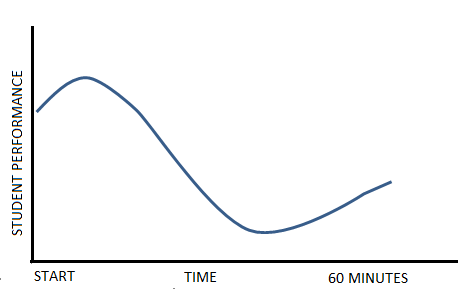
Learning curve in lecture (Bligh 1998)
The X-axis, the one which runs horizontally denotes lecture time and the Y-axis, the vertical line shows student performance. As discussed in the beginning, here the graphical line drops sharply during the lecture from a high level and shows a slight increase in attention towards the end.
Typical students’ attention cycle ranges from 10-12 minutes, i.e., 12 or 15 minutes long. A study has found that the attention span of note-taking students also declines over the course of the class. However, the gentle increase towards the end, whether one hour or less, indicates that the central part of the lecture can be ineffective and requires other possible strikes to boost attention.
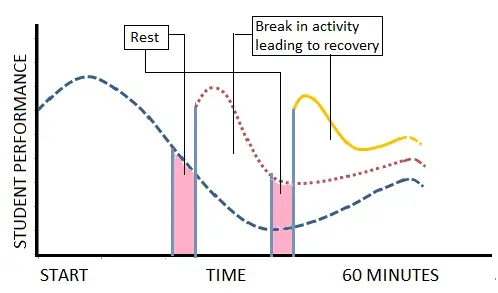
Decline-Recovery-Decline Graph
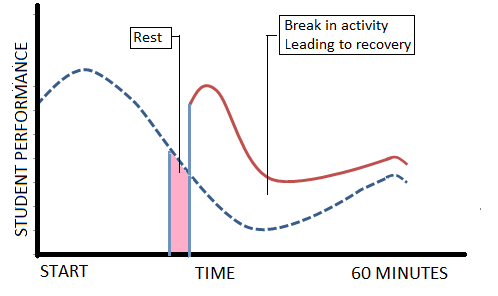
Learning curve in lecture (Bligh 1998)
The representation shows the duration of the lecture on the X-axis and student performance on the Y-axis. The graphical illustration displays that rest or breaks in between the lecture can improve the attention span though it slopes down again after a while. The line declines towards the end of the first half of the lecture and after the break, there is recovery for a few minutes and again recede before showing a rise as the class finishes. The recovery rate can count on the type of activities or the way speaker tackles the students.
Three Declines And Recoveries Graph
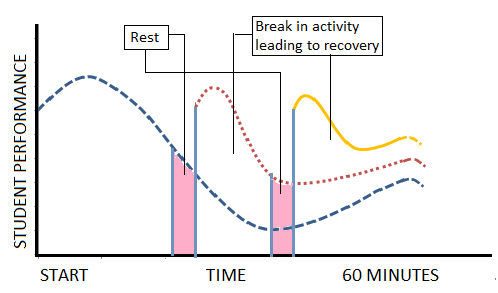
Learning curve in lecture (Bligh 1998)1
The Y-axis indicates student performance and X-axis the time of the lecture. The student performance increase as well as decrease thrice with respect to the activities between lectures. The peaks and fall of the line show the number of breaks introduced. Frequent intervals; let’s say one in 15 minutes can bring down the rate of attention lapse, same time balances the lost few minutes of “speaking” which ultimately reaps no grades!
All these explanations imply those of who are still not able to accomplish the perfect teacher title; grabbing student attention to drive performance is one significant way to advance learning and make lectures effective. During some classes, you may even see few sluggish faces or less-interested ones as lecture progress and might get that stumbled-feeling, do some brain-activating tricks; throw few random jokes or discuss on a happening issue or start a quiz. By the end of the lecture, you can collect the lecture notes of the first row students and check where all you failed, not able to maintain the attention graph. Assure the students that it’s not their problem and next time you will make the concept more illustrative and simple. An adept teacher adapts- measures not only the student performance but simultaneously looks for “change-up” in one’s lecture.
These demonstrations might imply that “attention” revolves only around classrooms. However, study (Harald Weinreich, Hartmut Obendorf, Eelco Herder, and Matthias Mayer, 2014)2 clearly tells that attention span is seen a drastic fall when compared to the previous decade. Let it not be the student community alone, the shocking consequence of our “always on” instant gratification on social life, with rise in work and family pressure have triggered constant spikes in attention span. When it comes to engaging team members during a meeting, research (Robert, 1876)3 states that a person soon becomes restless after 20 minutes (that too not sustained attention)- suggests that average attention span of the colleague is vital to the success rate of the conference. If the meeting is compelling, the degree of participation and energy to interact increase no matter how long the programme. The topic of the workshop can be recurring but to hold the concentration levels of the team is adequate. To keep up a steady graph among employees;
- Engage in some activities like an “ice-breaking” activity or a quick game lasting for a few seconds before the start of the session.
- It is good to speak for 20 minutes, tick of the next minute interact with the team-mates on the particular section.
- Every few minutes or seconds throw some attention captivating stimulus.
- Use of breakout rooms is advisable as to form small groups and to discuss the specific topic.
- Change the style of presentation.
If leaders are ready to embrace conference or a group discussion and transform into an “active forum”, getting work done is easier.
References
- Bligh (1998). What’s the use of Lectures. Exeter: Intellect.
- Harald Weinreich, Hartmut Obendorf, Eelco Herder, and Matthias Mayer: “Not Quite the Average: An Empirical Study of Web Use,” in the ACM Transactions on the Web, vol. 2, no. 1 (February 2008), article #5.
- Henry Martyn Robert, Robert’s Rules of Order (1876)
RETROSPECTING MOBILE APP ONLY STRATEGY OF FLIPKART
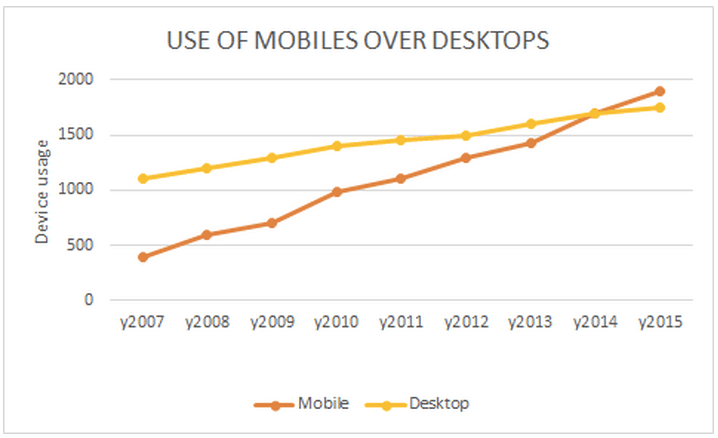
In a developing country like India where more smartphones are found than PCs and laptops, the move in focus of Flipkart along with Myntra onto the mobile app seems to be logical. Is it possible by these basic statistics to bring them the expected customers to use their mobile app for purchasing online? A purchasing journey is much more complex than researching and buying everything using a mobile. There are several touch points in the consumer journey to purchase. Mobile might be playing a bigger role in India in the consumer journey, but we can’t ignore the buying behaviour of Indian consumers.
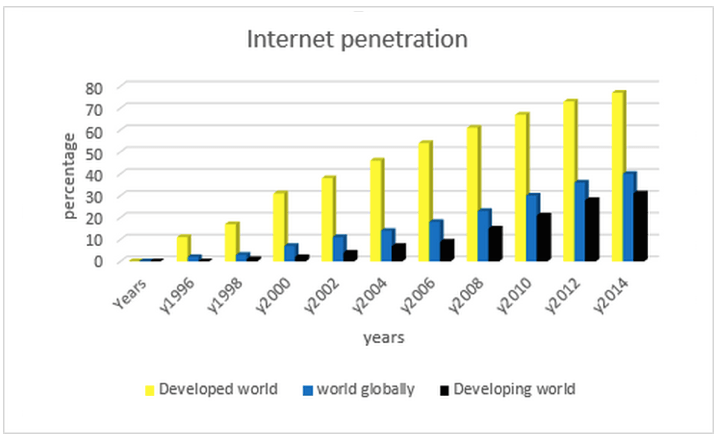
As it is seen from the graph, the number of people using desktops were more until the year 2014 in India, when mobiles took over their role. Thus there is a rise in the use of mobiles since 2014. Whereas while considering the internet penetration of the developed world, the world globally and the developing world, the same seems to be much low among the developing worlds which include India. When the internet penetration is high among the developed countries and has risen quite well since the year 2000, the developing world seems to have risen at a very meagre level.
Heated debates and discussions are taking place on many websites and forums regarding this step taken up by Flipkart and Myntra. It was announced that Myntra would no longer be available on the desktop as well as the mobile website from May 15, 2015. Now it is Flipkart that is taking this major step into the app – only strategy within a year. The strategy may seem logical to Flipkart/Myntra at the helicopter view. It allows them to manage a single sales channel, data could be protected than mobile web, personalising shopping experience etc. However, there are several factors to be considered in Indian context such as consumer behaviour, growing internet adoption, connection speed, device usage, price sensitivity, availability of product information and recommendations, consumer ratings, the growing income of middle class.
INCREASED MOBILE TRAFFIC
The mobile traffic has increased 10 fold in the last eighteen months in India and according to Ericsson study, it was proved that the 58% of the people who do not use e-commerce services on smartphones said that they would be starting it within a year. This shows the increasing customer adoption of mobiles with internet facility in them.
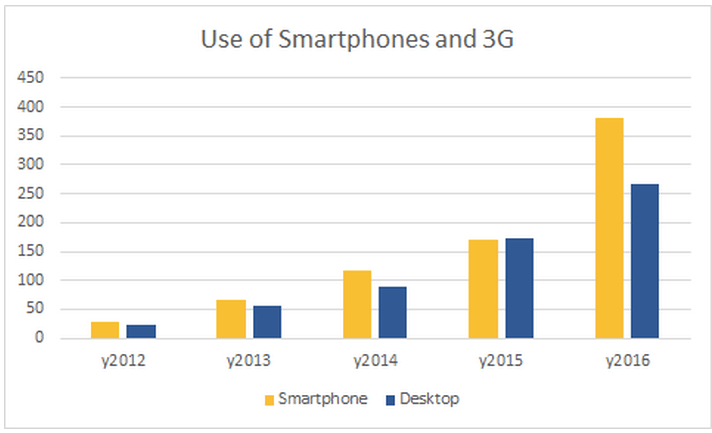
The number of individuals who used the internet through smartphone increased from 120 Mn to 140 Mn by 2014 in India. What the founders of the company say is that according to their observation, among the 90% traffic that Myntra acquired, 70% of the purchases were from Mobile apps which almost comes up to 9 million customers. This ensured them that the people who actually wanted to shop seem to be buying it through their personal accounts on their apps on phones. But this surge in the purchase from mobile apps must have been due to the additional discount that they offered for the purchases made through the mobile app. On top of this everyday new users are connected to internet in India and would eventually become matured users. They would then start internet shopping when they are matured internet users.
PERSONALIZATION
By converting all the purchases through the mobile app, they are trying for geo – targeting and to make shopping more personalized. Geo – targeting in geo – marketing and internet marketing is the method of determining the geolocation of a website visitor and delivering different content to that visitor based on his or her location, such as country, region/state, city, metro code/zip code, organization, IP address, ISP or other criteria. They say that they want customized feeds for everyone based on their interest. In short they want their customers to have the best purchasing experience. This might be their intention.
RESEARCH OR PURCHASE?
Till date every product could be seen in detail on our computers or laptops. Customers may have checked or browsed through the products through the mobile. But purchases are made only after close inspection of the product. Even then there have been news about cases where the dress did not look like how it was shown in the picture and that sort of complaints. In such a case, how would it be if everyone used the mobile app which has such low resolution to make a purchase worth thousands! (HuffingtonPost Online Shopping, 2015) That sounds hilarious and one would rather not get the product than get stuck with the wrong one. The product view inside the mobile app makes many categories vulnerable to no purchase. Many categories require big screen views. If the clothing category is considered, one – third of the goods are returned in many of the online purchasing websites.(Abcnews Sussana Kim, 2013)
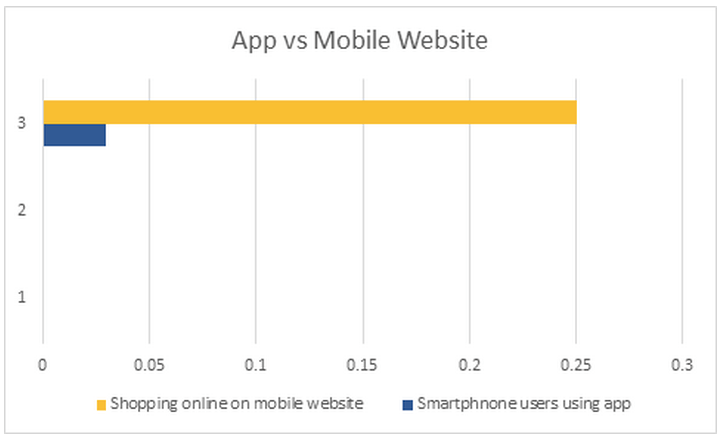
PUSH MESSAGE STRATEGY
Everyone might have a smartphone. But all do not work in the same smart fashion. Some are slow, some do not support apps, some phones are old and there are different types of phones available in the market these days and one buys the best that he can afford. When the mobile app strategy comes into the forefront, people will be forced to install the app if they have to make a purchase. But this would result in the consumption of too much of space (trak.in › Internet › Ecommerce) in one’s phone, one would rather not buy online than get their phone slow or stuck. Moreover some phones do not even support such apps. Thus the removal of mobile websites would not only result in the loss of customers but also in the denial of their privilege of making purchases online. The strategy of the company includes the generation of push messages every day to the app user. If a person has installed 20 apps, each app would send a minimum of 2-3 push notifications every day. This would sum up to around 50 notifications and with the other message notifications from friends and family, the number might rise to a hundred, which is too much for an individual to take. Earlier marketers could use unlimited SMS in order to let their customers know about the discounts and offers. Now, according to the regulations put forward by TRAI, there is a limit for the SMSs that can be sent. If a similar control comes for notifications, it would not be as bad as it sounded earlier.
The great gaming company Zynga came down as Facebook decided to not support Zynga notification system. Initially they supported the company and later they changed Facebook notifications into push notifications when the people would get Zynga notifications only if they wanted to.
A mobile phone is a much more affordable device and is handy when compared to a desktop. A person who uses a smartphone checks the phone at least 150 times a day and it would not be great if the individual has to go on clearing the push messages that is not necessary for him/ her then.(Are Flipkart and Myntra correct in following a mobile app-only strategy?, 2015)
INDIA – A PRICE SENSITIVE MARKET
India’s is a price sensitive market. In such a market people would never buy a product without comparing it with another one which might of a different brand and from a different place. But when people are constrained to the mobile apps, this option would be erased which thereby brings commotion among the customers as they lose the opportunity to compare and buy the best available in the market. In every manner this move made by Flipkart and Myntra may have a negative impact on the people and they have voiced it out as well. Around 58% of the people are against this strategy and it is just 19% that actually supports it. The rest do not even bother commenting on it.
![Source: [Online] ‘Flipkart to Shut Down Mobile Website; Will 213 Million Internet Users Of India Follow Suit?’ Author: Preetha Bose. Date: March 20, 2015.](https://cdn.prod.website-files.com/67e3ed379c42638b4aff7ec1/68061623f56e5368ec24d6a9_Responses-regarding-Flipkarts-mobile-app-only-strategy.png)
Author: Preetha Bose. Date: March 20, 2015.
The strategy of mobile app only purchase would put new start – ups at great risks. So unless and until a company is established and is sure that their customers would stay even they take this move, should they do it. But it is always said that a company should have multiple ways of marketing their products and this actually shows a major improvement and rise in their sale. This approach works only for the bigger developers as this assumes that almost 80–90% of users have your app installed on their Android phones at all times. India is primarily an Android market and hence this may not seem like a bad bet, but I personally do not think Flipkart or Myntra would have more than 25–30mn monthly active Android devices installed. Out of a 80+mn Android users, this still leaves around 60% of users in market not being able to find any results from Flipkart/Myntra when they do a Google search on their phones.
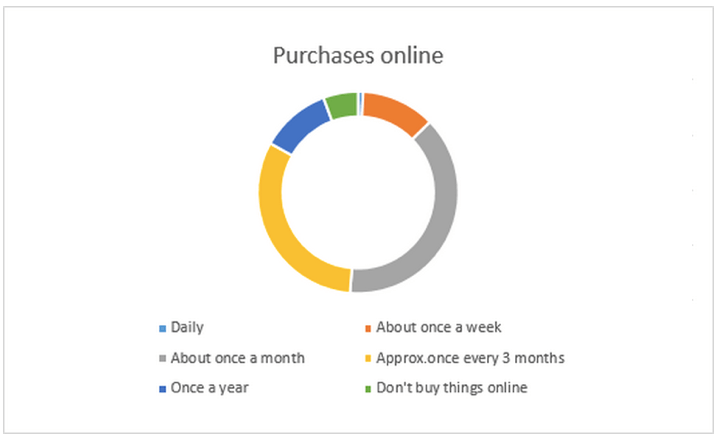
From the survey shown by ‘Information on the Survey ExperienceU.com’,(www.spiro.ir/photo/Do-You-S-Hop.html), people who made purchases online daily was just 0.8%. The people who made online purchases once a week was 11.9%. About 38.6% of people purchased online once a month and approximately 31.8% of people made online purchases once every 3 months. 11.3% purchased online every year. Less than 6% did not make online purchases at all.
MISSING THE NEW CUSTOMER’S OPPORTUNITY
The app – only strategy would restrict the new customers from purchasing from Flipkart or Myntra as they will have to download the app and install it in order to use it. As it pointed out earlier everyday new users are getting connected to the internet in India. There are still lot of opportunities to add new internet users as customers of Flipkart.
Every purchase start with a need. For eg: a when a mother delivers a baby they would look for ‘baby clothes’ for instance. They need information to satisfy their need. This would bring them to the search engines. Over 73% of product purchase start with a search on search engines (ThinkWithGoogle, Purchasing Journey, India). A Google search on a mobile might be the first touch point in the consumer buying journey. An app only strategy hinder the product information to be indexed in search engines. This restriction makes Flipkart non accessible to new internet users. Flipkart could push big TVCs and other offline campaigns to generate brand impressions. But the marketing budget to push big TVCs are humongous compared to the information accessible via search engines. Flipkart may not want to rely too much on big search engine such as Google in the long term strategy, but I think the decision of mobile app only strategy is quite early in the Indian scenario.
People usually install apps only after several considerations. They ask someone they know, be it a relative or a friend regarding the company and then decide whether to make a purchase or not. So people might end up being reluctant to install the app for a purchase or two. This users might be long term buyer with Flipkart/Myntra. According to the survey, just 38.6% of people shop at least once a month. For this, it is not necessary that they would be ready to install apps on their mobiles. This would in turn benefit competitors, especially Amazon which would not drop its mobile website scheme as they have enough and more customers. Search engines are provided for the people to know about various things that they are searching for. But if Flipkart moves on to the mobile app and removes its online websites, it would be really hard for a new customer to find and know about Flipkart and the chances are really low for them to know that such an app exists. This would deprive Flipkart of their new customers as the product information would be limited into the app alone.
EFFECT OF ANTI NET – NEUTRALITY SCHEME
From the recent Net-Neutrality and Airtel Zero episode we’ve seen that Flipkart and certainly not Myntra isn’t treated as a utility service and consumers do consider them expendable. Unlike Messaging(WhatsApp/WeChat/SnapChat) or Social network services(Facebook/Twitter/Instagram) which are used for many hours per month per user, my hypothesis is that an average user doesn’t transact more than couple of times a month on an e-commerce app. The mobile app only strategy may be prudent to serve the existing customer base by giving best customer experience. But the Indian market is not yet a matured market where many users are getting internet enabled every day. Flipkart mobile only strategy limits them to reach new internet users thereby helping Amazon to acquire those customers.
To sum up, Flipkart had either ways decided to move forward with their strategy. What they have to be aware of is that they are actually in a very competitive world where brand could circumpass the other with just one error made. The considerations of adding new internet users and understanding the buying behaviour of Indian customers are two areas both Flipkart or Myntra haven’t taken any consideration. Both points are very important from a business point of view. Let this move as they have planned have a successful impact on them as they had dreamt or it may lead to Amazon’s rise over Flipkart in the near future. So it is basically live or die!
References
- Mehta. Is it already time to kill your mobile website? [Online]March 23rd 2015.Available from: Your Story. http://yourstory.com/2015/03/app-only-strategy/. [Accessed: 12th May 2015].
- KJ Shashidhar.Flipkart, Myntra shut down their mobile websites and push to app- only mode. [Online]March 20th 2015.Available from: Medianama. http://www.medianama.com/2015/03/223-flipkart-myntra-shut-down-their-mobile-websites-and-push-to-app-only-model/.[Accessed: 11th May 2015].
- Dhapola. Myntra will app- only from My 15, to shut down desktop site; Flipkart nulls similar route. [Online]May 11th 2015.Available from: Indian Express. http://indianexpress.com/article/technology/social/myntra-will-be-app-only-from-15-may-as-flipkart-mulls-similar-route/.[Accessed:12th May 2015].
- PK Jayadevan.Online retailers like Flipkart & Snapdeal turn marketing focus to mobile. [Online]December 11th 2014.Available from: Economic Times. http://articles.economictimes.indiatimes.com/2014-12-11/news/56955238_1_amazon-india-flipkart-mobile-app.[Accessed:12th May 2015].
- FP Staff.Mobile first strategy: Flipkart just acquired mobile marketing for, Appiterate. [Online]April 29th 2015.Available from: F.Business. http://www.firstpost.com/business/mobile-first-strategy-flipkart-just-acquired-mobile-marketing-firm-appiterate-2219138.html.[Accessed:12th May 2015].