
How is bounce rate calculated in GA4 and what replaces the bounce rate in GA4?

Table of Contents
Analyzing website performance has always involved a crucial metric – bounce rate. But with the arrival of Google Analytics 4 (GA4), things have changed., there have been significant changes in how bounce rate is calculated and interpreted. In this article, we will explore the revised method of calculating bounce rate in GA4 and discuss the new metric that replaces it.
What is Bounce Rate?
The bounce rate is a metric intended to indicate the level of engagement among visitors to your website. In Analytics, a bounce occurs when a visitor arrives on your website but doesn’t navigate to other pages before leaving. The higher the bounce rate, the worse it is.
For example: Let’s say you have four visitors to your website. Two of them only look at one page each and leave, while the other two explore two pages each before leaving. In this case, your bounce rate would be 50%. Half of the visits resulted in only a single page view.
- The bounce rate is the percentage of website visits where users only viewed one page and did not interact further or request additional information from the Analytics server.
- An engagement event is any event that indicates user interaction with your website or app.
- You can define these events, consisting of various actions such as viewing pages, clicking on elements, submitting forms, playing videos, and more.
- By default, the engagement events in GA4 include page_view, scroll, search, and ad_click.
Traditionally, in previous versions of Google Analytics, bounce rate was calculated based on a single-page session, where a user’s interaction was limited to a single pageview.
How is the bounce rate calculated in GA4?
GA4’s approach to measuring bounce rate has undergone a fundamental shift. Instead of relying solely on single-page sessions, GA4 introduces a more nuanced concept known as “engaged sessions.” To calculate the Bounce rate in GA4, divide the number of single-engagement sessions by the total number of sessions and multiply by 100 to get the percentage.
Bounce Rate = (Single-engagement sessions / Total sessions) * 100
Engaged Sessions and Bounce Rate: An engaged session in GA4 is where a user interacts with the website or app for a certain duration or performs an event that indicates active engagement. This includes scrolling, clicking on a link, playing a video, or submitting a form. Consequently, a session with a single pageview can still be considered an engaged session if the user spent a significant amount of time on that page or completed a valuable action.
What replaces the bounce rate in GA4?
- In Google Analytics 4 (GA4), the concept of bounce rate used in Universal Analytics is replaced by the concept of engagement rate.
- In GA4, the concept of a “bounce” is different from Universal Analytics. In Universal Analytics, a bounce was recorded when a user only viewed a single page of your website. In GA4, a bounce is recorded when a user exits a session after a single engagement event, regardless of the number of pages viewed.
- When GA4 was introduced, a new metric called engagement rate was also introduced. In simple terms, the bounce rate is the opposite of the engagement rate (100% – engagement rate).
- Remember that GA4 provides a more event-driven and flexible approach than Universal Analytics, and you can define your own engagement events based on your specific tracking needs.
What is the Engagement rate in GA4?
- The engagement rate is a valuable metric for evaluating the effectiveness of your content, user experience, and overall website/app performance in terms of engaging and retaining visitors. It helps you identify areas where user engagement can be improved and informs strategies for enhancing the user experience.
- It provides insights into how actively users engage with your content beyond single-page visits.
- By considering both the duration of the session and the occurrence of multiple engagement events, GA4’s engagement rate provides a more comprehensive understanding of user engagement and involvement compared to the traditional bounce rate. A higher engagement rate indicates that users actively interact with your website or app, explore multiple pages, spend more time, and potentially take desired actions, such as conversions or completing goals.
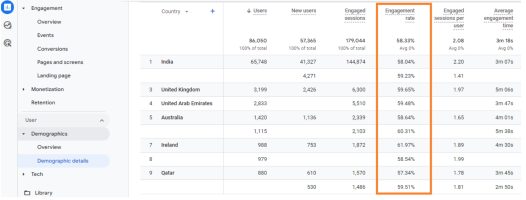
- In Google Analytics 4, you can locate the engagement rate within some of the default reports.
For example:
- Navigate to “Demographic Details report”. If you have linked Google Search Console, you can find the engagement rate metric in the “Google Organic Search Traffic” report.
- Interestingly, it is not included in the default ‘Pages and Screens’ report or the ‘Engagement Overview’ report. However, you can customize these reports and add the engagement rate metric if you have edit or admin-level permission.
Below is a Comparison table between bounce rate in Universal Analytics (UA) and engagement rate in Google Analytics 4:
A few more alternatives can be used:
VIEWS PER USER: The ‘Views Per User’ metric helps understand how frequently people interact with each page on your website on average. Let’s take an example: If a person visits your home page, then goes to your contact page, and later returns to the home page, the home page would have received two views. On the other hand, if another person visits your home page and leaves without viewing any other page, it would count as one view for the home page. In this scenario, we would have three views of the home page (two from the first person and one from the second) and two users. To calculate the ‘Views Per User’ for the home page, we divide the total number of views (three) by the number of users (two).
3 views / 2 users = 1.5 views per user
AVERAGE ENGAGEMENT TIME: It provides insight into the average duration people spend on each page. It is a useful metric, especially when you anticipate visitors will find all the necessary information on a single landing page.
UNIQUE USER SCROLLS: It indicates the number of individuals who have scrolled through at least 90% of a page. It provides an understanding of the engagement level and shows how many users have interacted with the content by scrolling down the page.
How to add bounce rate to standard reports in Google Analytics 4?
Assessing your bounce rate in GA4 can be a bit challenging:
- First, go to the Reports on the left tab. Then, click > Engagement > Pages and screens.
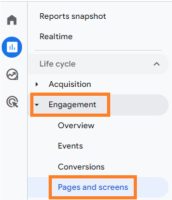
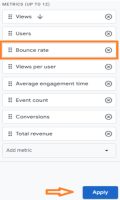
- To personalize the report, click on the edit icon at your screen’s upper right corner. This will bring up a sidebar on the right side of the icon. Select >Metrics. It will show the default metrics included in the Pages and screens report. Click Add metric at the very bottom.
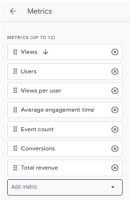
- Select “Bounce rate.” Click and drag the “Bounce rate” label to move it up so that it’s one of the first columns (refer the image below). Then, click “Apply.”
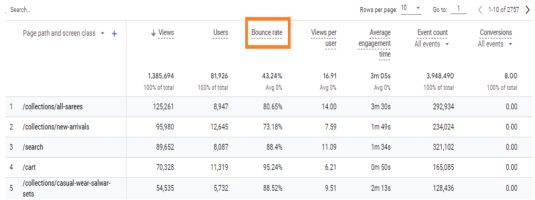
- The bounce rate is now reflected in the report. So, click > Save > Save changes to current report > Save.
- You can now verify that you have effectively personalized the standard report by adding the bounce rate.
Conclusion:
GA4’s revised approach to measuring bounce rate, as part of GA4 implementation, brings a more nuanced and insightful perspective on user engagement. By shifting the focus from single-page sessions to engaged sessions, GA4 better understands how visitors interact with a website or app. In addition, the introduction of metrics such as Engagement Rate and Engagement Time provides a more comprehensive analysis of user behavior, enabling businesses, with the assistance of a GA4 Agency, to optimize their digital experiences and drive meaningful engagement with their audience.
.png)


