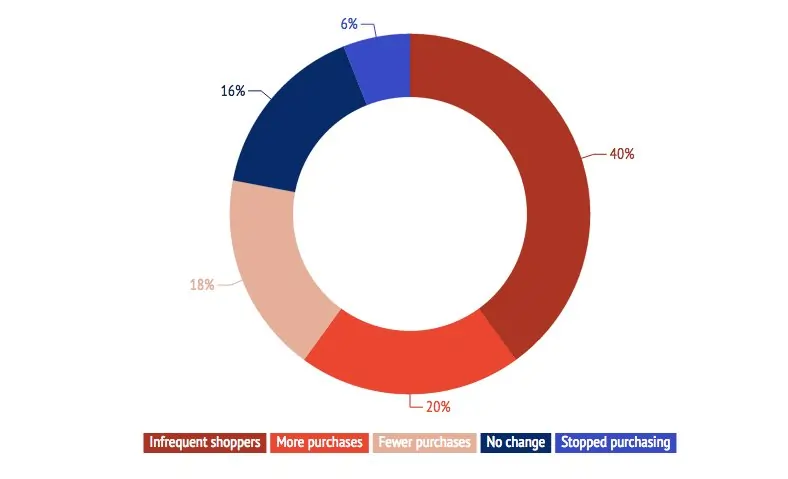
How to Build Custom Reports in GA4 and Understand the Differences Between Reports, Explorations, and Looker Studio
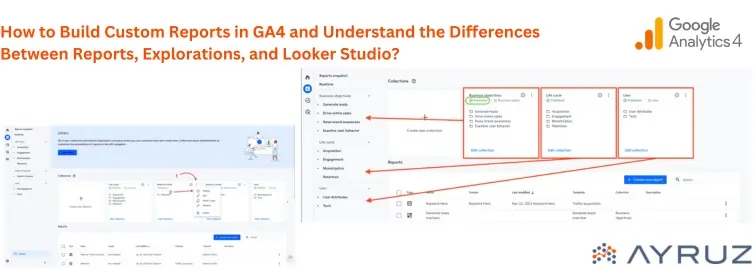
Table of Contents
Google Analytics 4 (GA4) offers multiple ways to analyze user data through Custom Reports, Explorations, and Looker Studio. Each tool serves a different purpose and helps businesses track user behavior effectively.
One common use case is tracking the sign-up process on a website, where we need to measure:
- Total users who viewed the sign-up page
- Users who started the sign-up process
- Users who completed the sign-up
In this guide, we will walk through:
- How to create a Custom Report in GA4 for a Sign-Up Funnel
- How it differs from GA4 Explorations and Looker Studio
- Why and when to use each tool for reporting
What Are GA4 Custom Reports, Exploration Reports, and Looker Studio?
1. Custom Reports (Reports Section)
Custom Reports in GA4 are pre-built reports that allow users to track key metrics over time without the need for advanced customization.
- Found under the “Reports” section in GA4.
- Used for ongoing tracking (e.g., sign-up conversion trends).
- Can be saved and accessed by multiple users.
- Best for: Regular reporting of predefined metrics like page views, conversions, and user engagement.
Limitations:
- Less flexible than Explorations.
- No advanced segmentation or custom visualizations.
2. Exploration Reports (Explore Section)
Explorations allow deeper analysis with customized charts, funnels, and segment comparisons.
- Found under “Explore” in GA4.
- Used for ad-hoc analysis and detailed funnel tracking.
- Includes funnels, cohort analysis, and path exploration.
- Best for: Identifying drop-offs in user journeys and analyzing behavior patterns.
Limitations:
- Not shareable as a report (only available in GA4).
- Requires more configuration compared to Custom Reports.
3. Looker Studio (Formerly Google Data Studio)
Looker Studio is an external dashboarding tool that connects to GA4 and other data sources to create interactive and shareable reports.
- Used for combining multiple data sources (GA4, Google Ads, CRM, etc.).
- Allows custom charts, real-time filtering, and user-friendly dashboards.
- Best for: Creating client-facing reports and visual dashboards with real-time updates.
Limitations:
- Requires setup and external data connections.
- No built-in funnel reports (needs manual setup).
How to Build a GA4 Custom Report for Tracking Sign-Ups
Now, let’s create a Custom Report in GA4 that tracks a Sign-Up Funnel:
- Step 1: Track total users who visit the sign-up page (
/signup). - Step 2: Track users who start the sign-up process (
SignUpStart). - Step 3: Track users who complete the sign-up (
SignUpEnd).
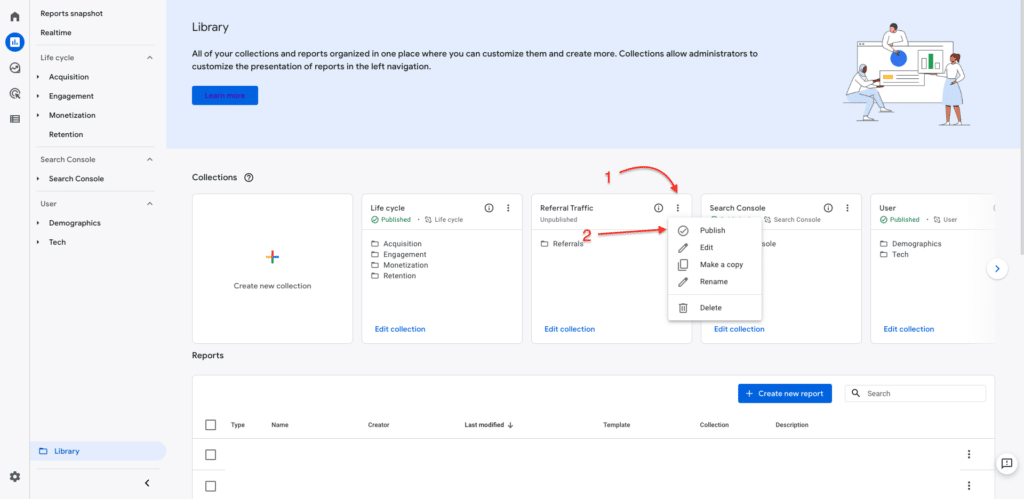
Step 1: Open GA4 and Navigate to Reports
- Log in to Google Analytics 4.
- Click on “Reports” in the left-hand menu.
- Scroll down and click “Library” (only visible to Admins & Editors).
- Click “Create New Report” → “Create Detail Report”.
An image showing the navigation to the Reports Library.
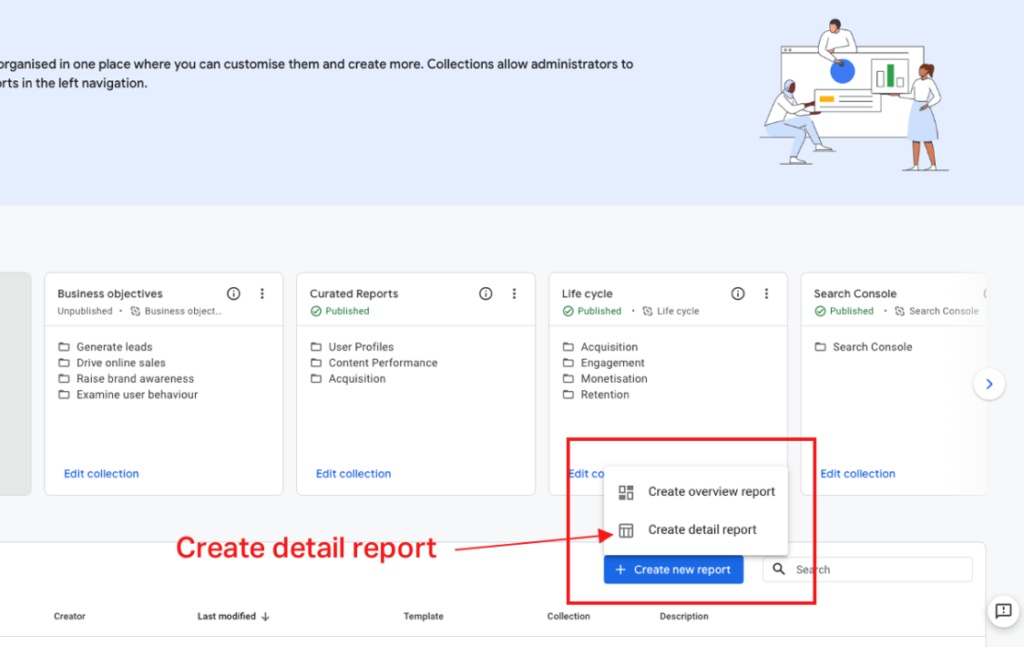
Step 2: Set Up Report Dimensions & Metrics
- Name the Report →
"Sign-Up Funnel Analysis". - Click “Add Dimension” → Select:
- Page Path and Screen Class (to track the Sign-Up Page
/signup). - Event Name (to track
SignUpStartandSignUpEnd).
- Page Path and Screen Class (to track the Sign-Up Page
- Click “Add Metric” → Select:
- Active Users
- Event Count
- Conversion Rate
An image showing the dimension and metric selection.
Step 3: Add Filters to Track Sign-Up Stages
- Click “Add Filter” and set up the following:
- Filter 1: Track Sign-Up Page Views
- Event Name =
page_view - Page Path =
/signup
- Event Name =
- Filter 2: Track Sign-Up Starts
- Event Name =
SignUpStart
- Event Name =
- Filter 3: Track Completed Sign-Ups
- Event Name =
SignUpEnd
- Event Name =
- Filter 1: Track Sign-Up Page Views
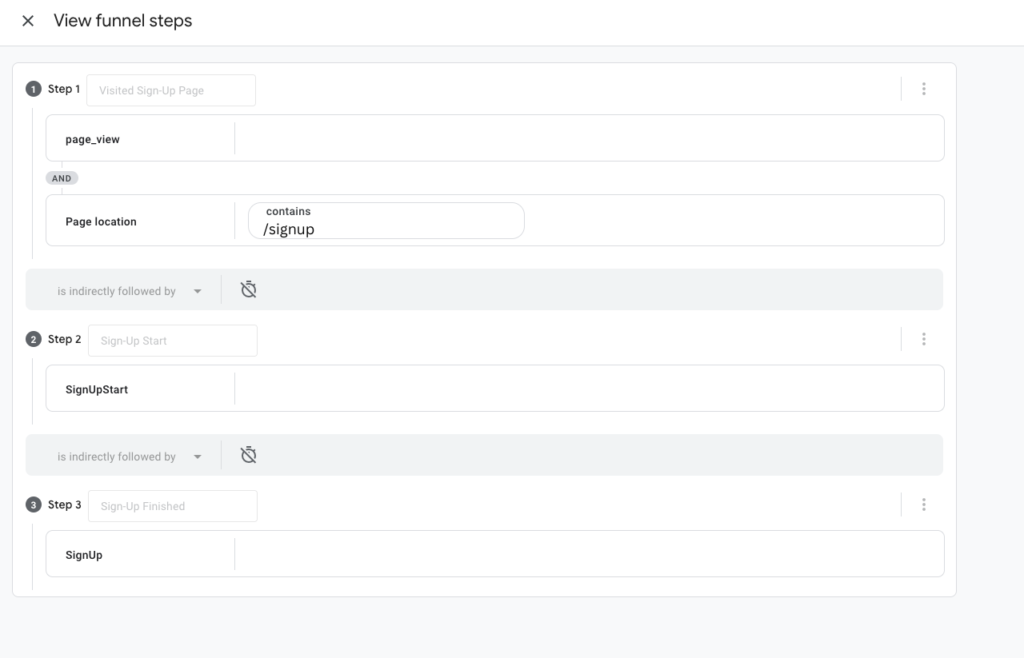
An image showing how to apply filters.
Step 4: Save and Publish the Report
- Click “Save”.
- Click “Save to Library” to make it accessible for all users.
- To add it to the Reports section:
- Go back to Library.
- Click “Edit Collection” and add Sign-Up Funnel Analysis to a relevant category.
- Click “Save & Publish”.
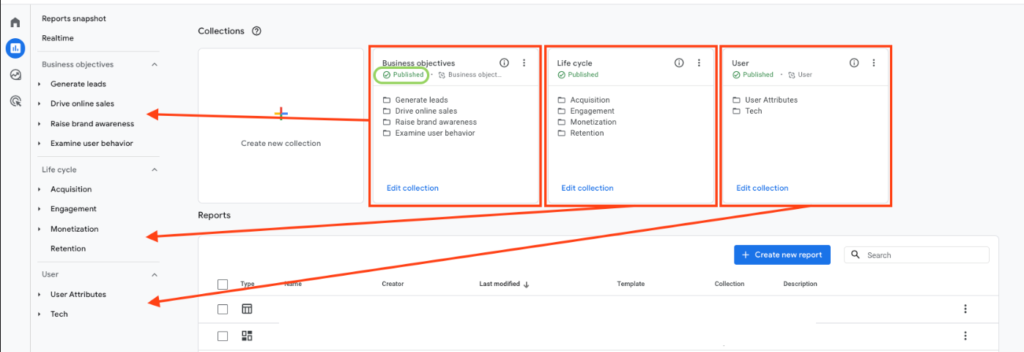
An image showing the final save & publish step.
How to Analyze the Custom Report
Once saved, open your Sign-Up Funnel Report to analyze:
- Total Visitors to the Sign-Up Page (
page_view). - Users Who Started the Sign-Up Process (
SignUpStart). - Users Who Completed the Sign-Up (
SignUp). - Conversion Rate = (SignUp / page_view) * 100.
If you see a high drop-off between page_view and SignUpStart, the issue could be:
- Confusing form fields.
- Slow page loading.
- Lack of trust signals (e.g., testimonials, security badges).
If you see drop-offs between SignUpStart and SignUpEnd, users may:
- Abandon due to too many steps.
- Face form validation errors.
- Be reluctant to share personal data.
Hire. Build. Accelerate. See what that looks like for you.
Contact Us.png)

Sanil Subash Chandra Bose


Sanil is the Founder of Ayruz Data Marketing, a global digital solutions company helping businesses scale through remote talent, AI-driven strategies, and performance marketing. With over 15 years of experience across the US and UK markets, he’s advised Fortune 500 brands and startups alike on growth, data, and digital transformation. A member of the Forbes Agency Council, Sanil is known for blending strategy with execution to drive measurable business outcomes.