“Are you with me?”, the obvious way a teacher measures the attentiveness of students. The long-established question takes its place more prominent in classrooms these days. It seems that most of the new generation lecturers find it alarming that getting student attention is increasingly difficult compared to preparing the lecture notes! The lecture hours can last up to 45 to 60 minutes, and what students usually commit to is “poor” attention. Addition to the distractions the present era owes, they brood over in thoughts, fidget or doze off in between, there is only passive absorption of information and apparently, teachers go exasperated. During the start of the lecture, there might be high levels of responsiveness, but as the session progress, you may even see a row of students slumped on their desks or being restless, suggests a drastic drop in attention.
Attention and performance levels vary from student to student, studies indicate that performance can be assessed by;
- The not-scribbled legible part of the lecture notes taken down
- The ability of students to recall the class
- The questions students can answer about the section of the lecture
Continued attention might fluctuate with the quality of the lecture, motivation, emotions, time of the day and other deviating factors. Lecturers involve in different activities to captivate students and increase the span of attention – visuals, video clips, demonstrations, encouraging students to participate in a quick chit-chat, to take a break, even asking to pick the occasional sleeper of the class. Many types of research and surveys state that each student exhibits a different pattern of attention and performance levels, varying with lectures.
Attention graphs on lecture time and student performance can be a modest way to demonstrate it. If we focus on the reports by (Bligh, 1998) it divides into four.
Horizontal Line Graph
Student attention line in a lecture (Bligh 1998)
The graph shows student performance along Y-axis and lecture duration on the X-axis. This graphical representation reminds us of those beautiful lecture sessions, never to be missed or look for any in-between pauses. The steady horizontal line shows high or unwavering attention span, a rare occurrence indeed. This happens if one is lucky to be that “ideal teacher” or the “captivating orator” which students look up to.
Dramatic Decline Graph
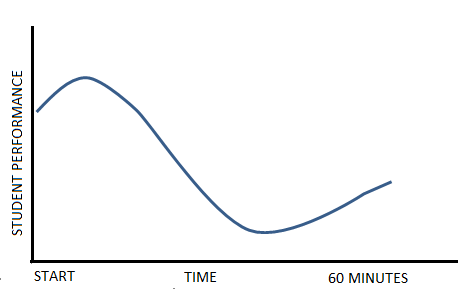
Learning curve in lecture (Bligh 1998)
The X-axis, the one which runs horizontally denotes lecture time and the Y-axis, the vertical line shows student performance. As discussed in the beginning, here the graphical line drops sharply during the lecture from a high level and shows a slight increase in attention towards the end.
Typical students’ attention cycle ranges from 10-12 minutes, i.e., 12 or 15 minutes long. A study has found that the attention span of note-taking students also declines over the course of the class. However, the gentle increase towards the end, whether one hour or less, indicates that the central part of the lecture can be ineffective and requires other possible strikes to boost attention.
Decline-Recovery-Decline Graph
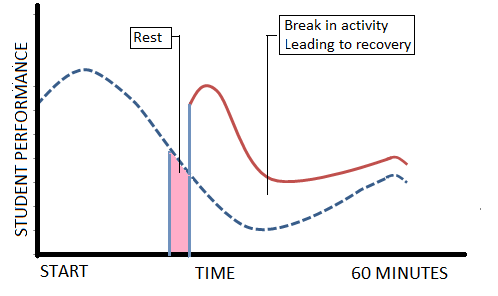
Learning curve in lecture (Bligh 1998)
The representation shows the duration of the lecture on the X-axis and student performance on the Y-axis. The graphical illustration displays that rest or breaks in between the lecture can improve the attention span though it slopes down again after a while. The line declines towards the end of the first half of the lecture and after the break, there is recovery for a few minutes and again recede before showing a rise as the class finishes. The recovery rate can count on the type of activities or the way speaker tackles the students.
Three Declines And Recoveries Graph
Learning curve in lecture (Bligh 1998)1
The Y-axis indicates student performance and X-axis the time of the lecture. The student performance increase as well as decrease thrice with respect to the activities between lectures. The peaks and fall of the line show the number of breaks introduced. Frequent intervals; let’s say one in 15 minutes can bring down the rate of attention lapse, same time balances the lost few minutes of “speaking” which ultimately reaps no grades!
All these explanations imply those of who are still not able to accomplish the perfect teacher title; grabbing student attention to drive performance is one significant way to advance learning and make lectures effective. During some classes, you may even see few sluggish faces or less-interested ones as lecture progress and might get that stumbled-feeling, do some brain-activating tricks; throw few random jokes or discuss on a happening issue or start a quiz. By the end of the lecture, you can collect the lecture notes of the first row students and check where all you failed, not able to maintain the attention graph. Assure the students that it’s not their problem and next time you will make the concept more illustrative and simple. An adept teacher adapts- measures not only the student performance but simultaneously looks for “change-up” in one’s lecture.
These demonstrations might imply that “attention” revolves only around classrooms. However, study (Harald Weinreich, Hartmut Obendorf, Eelco Herder, and Matthias Mayer, 2014)2 clearly tells that attention span is seen a drastic fall when compared to the previous decade. Let it not be the student community alone, the shocking consequence of our “always on” instant gratification on social life, with rise in work and family pressure have triggered constant spikes in attention span. When it comes to engaging team members during a meeting, research (Robert, 1876)3 states that a person soon becomes restless after 20 minutes (that too not sustained attention)- suggests that average attention span of the colleague is vital to the success rate of the conference. If the meeting is compelling, the degree of participation and energy to interact increase no matter how long the programme. The topic of the workshop can be recurring but to hold the concentration levels of the team is adequate. To keep up a steady graph among employees;
- Engage in some activities like an “ice-breaking” activity or a quick game lasting for a few seconds before the start of the session.
- It is good to speak for 20 minutes, tick of the next minute interact with the team-mates on the particular section.
- Every few minutes or seconds throw some attention captivating stimulus.
- Use of breakout rooms is advisable as to form small groups and to discuss the specific topic.
- Change the style of presentation.
If leaders are ready to embrace conference or a group discussion and transform into an “active forum”, getting work done is easier.
References
- Bligh (1998). What’s the use of Lectures. Exeter: Intellect.
- Harald Weinreich, Hartmut Obendorf, Eelco Herder, and Matthias Mayer: “Not Quite the Average: An Empirical Study of Web Use,” in the ACM Transactions on the Web, vol. 2, no. 1 (February 2008), article #5.
- Henry Martyn Robert, Robert’s Rules of Order (1876)
Managing Director Analytics & Digital at Ayruz Datamarketing, He is the Co-Founder of Ayruz and MobME Wireless. He holds an MBA, Strategy and Entrepreneurship (University of Strathclyde) and B-Tech in Computer Science from Cochin University.


